

This is a huge week for markets. The big three central banks all meet and we have crucial data out on US CPI, retail sales, flash PMIs and UK inflation. Wow!
I’ll say only a few words on all this because I want to focus on the longer-term outlook for US inflation. Those few words are that all three central banks look set to hike by 50 bps … it’s the post meeting commentary that matters. I’d opt for hawkish from the Fed, for the reasons I’m about to explain, neutral on ECB and BoE where there might be unanimity with the two doves conceding no change. And watch out for suggestions on the central banks’ plans to reverse their quantitative easing programs.
There’s a massive supply of bonds due next month, especially in Europe and especially in duration terms. I’ll discuss this in more detail in the Opening Bell webinar on 12th January (see your CTI rep for details).
As for inflation, the pattern of huge upward surprises earlier this year in both the US and Europe was the biggest I’ve seen in decades but that’s behind us and there’s no reason to have a hawkish or bullish tilt.
But I am hawkish on the longer-term outlook for US inflation. I have to admit it’s a tricky argument to make because the numbers for both headline and core look set to improve. Headline CPI peaked in June at 9.1%. It’s already fallen to 7.7% and this week’s figures should see it falling further. It’s a flatter profile for core CPI but it too is headed lower as goods’ prices, notably autos, decline and lower oil prices have their second-round effect in areas like airfares. Base effects will help too as the big month-on-month rises in the last 12 months drop out of the year-on-year measures.
So why am I worried? Well, it’s wage inflation and I’ve been looking at wage inflation for job switchers versus job stayers. As you can see from the chart, the gap is at record levels. Those who move jobs are getting rises of close to 8%. That’s ahead of inflation. Okay, only by a smidgeon but real wage increases are rare in the developed world. And the gap is pro-cyclical, narrowing in recession – it actually went negative following the GFC, and the recent data demonstrate clearly that the red-hot labour market is boosting wages. Firms are losing workers to rivals and they are being forced to raise wages to keep their existing staff.
Now you might say that average hourly earnings, the closely watched series that comes out with payrolls, is showing no signs of acceleration. It peaked at 5.6% in March and has been on a gentle declining trend ever since. But that series is distorted by compositional effects. There was no furlough scheme in the US so 20 million workers were fired during the Covid lockdown. They were largely low paid workers so average wages actually went up even though nobody got a pay rise. The counterpart is that average wages are depressed this year as they are re-hired.
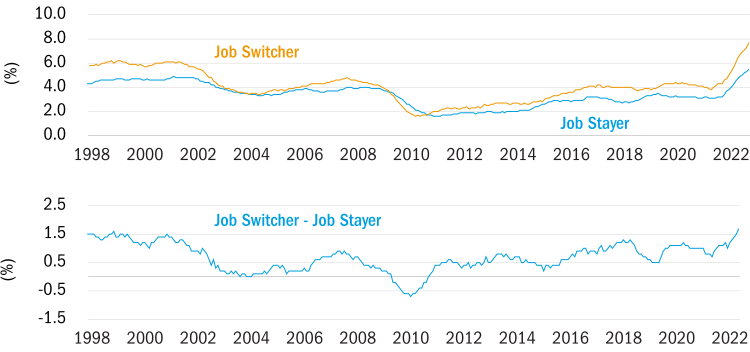
The series in the chart, compiled by researchers at the Atlanta Federal Reserve, compare the changes in wages of the same cohort of workers over the last 12 months. Now this does have its own problems, the sample gets a little small and there is something of an upward bias. But it’s still the best measure of US wages available monthly.
The series preferred by the Fed is the ECI (employment cost index) which is adjusted for compositional effects and has a much bigger sample size. But that’s only available quarterly and the monthly Atlanta Fed numbers have given a good steer for the ECI. We have to wait until the end of January for the next ECI and my guess is that it will be bad news for the inflation optimists. And that means that US inflation will prove sticky.
That’s bad news for short-term US interest rates and bad news for risk assets. What do we need for wage inflation to subside to levels needed to hit the Fed’s target? A rise in unemployment, a recession. And that’s not good news for risk assets either.
I’m sorry to strike a pessimistic note as we head towards the festive season. I’m wearing my winter woolly as it’s freezing outside but I’m forecasting warmer weather and a rally in equities further out, even if both go the wrong way first.
Until next week, goodbye.