


hk
HK
Hong Kong
en-HK
hk_inst_classes
inst
Institutional
en
en
For use by professional clients and/or equivalent investor types in your jurisdiction (not to be used with or passed on to retail clients)
Sunrise over a modern city skyline, with a tall skyscraper illuminated by the morning sun rising above a layer of low clouds and mist.

Insights

Pyrspectives – Profits are at record highs – Are markets too optimistic?

Luke Casey
Luke Casey
Senior Client Portfolio Manager, Head of Client Strategy

Explore Pyrford's Q3 2026 investment outlook covering bond yields, equity valuations, corporate profits and market risks.
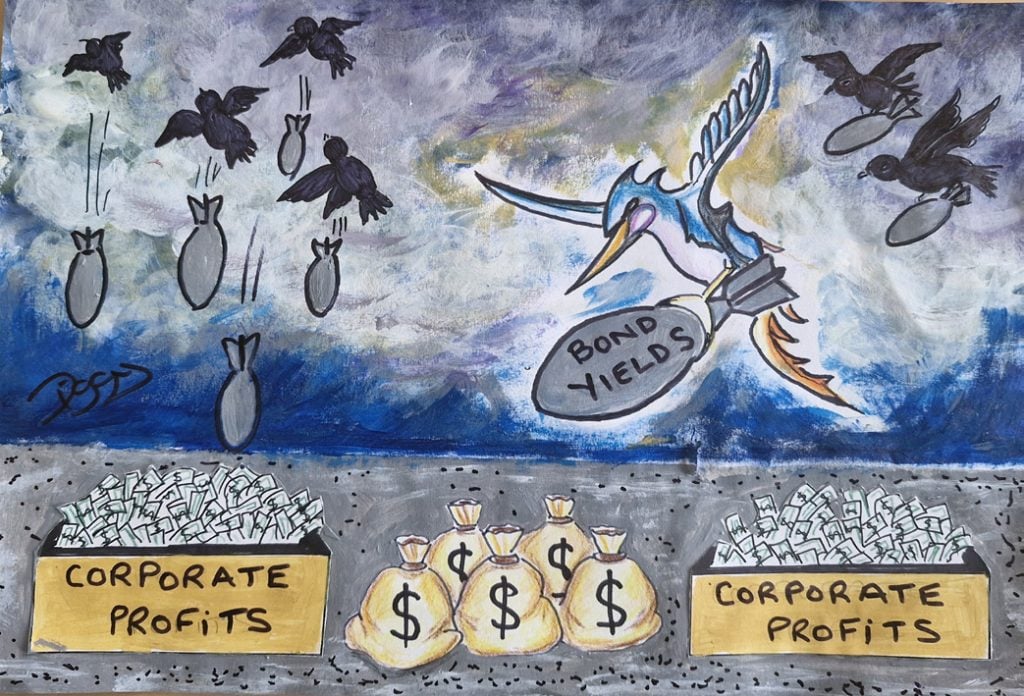
Illustration of Pyrford mythical creature logo carrying a bomb labelled "Bond Yields" while black birds drop bombs overhead. Below, two boxes labelled "Corporate Profits" are filled with money, alongside bags of cash, symbolising the impact of rising bond yields on corporate profits.

We’ve hit a fair few milestones this quarter. 5-and 10-year US Treasury yields have breached 5% amidst a global bond sell off. Year to date performance in USD on benchmark 10-year government bonds has been worst in France at -7.9% followed by Italy -7.4%, Germany -6.2%, US -4.3%, Canada, -4.2%, UK -3.4% and China the sole gainer at 7.1%. Brent oil has returned above $100 with prices of refined crude products like jet fuel, gasoline and diesel surging. Meanwhile, global equity markets continue to rally with MSCI ACWI, along with most indices across the major economies posting new highs in August or September.

Corporate Profits

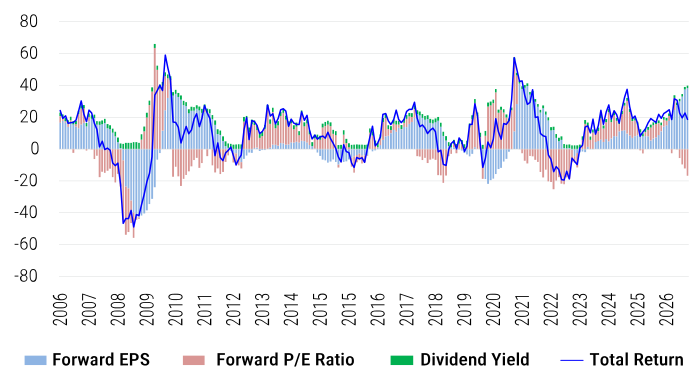
The stock market rally has undoubtedly been driven by earnings.

MSCI ACWI rolling 12M Total Return Decomposition (%)
MSCI ACWI rolling 12M Total Return Decomposition chart
Source: Refinitiv Datastream

Estimates of 12m forward earnings have grown 38% over the last year for MSCI ACWI. Whilst the contributors to earnings and total returns have been heavily concentrated around tech hardware sectors particularly in the US, South Korea and Taiwan, 92% of all constituents in MSCI ACWI are expected to post positive earnings growth next year (against an average of 80%). Further, whilst analyst expectations are usually optimistic, they follow impressive trailing EPS growth which has grown 30% over the last year. This impressive EPS growth has been built off the back of record high profit margins around the world.

So, what has driven this global profits boom? Zooming out, from a macroeconomic lens, the Kalecki-Levy profit equation seeks to explain this very question.1 The fundamental intuition behind the equation is that corporates ‘earn what they spend’. Business spending on wages, for example, fuels the same consumption that generates revenues and profits. If households save a larger share of their income, less spending is recycled back to companies. Aggregate profits therefore rise when businesses invest or pay dividends, governments run deficits, households reduce savings, or foreign demand strengthens, injecting additional spending into the economy.

The US profit share of GNP measured in NIPA (National Income and Product Accounts) is at record highs matching the trend in listed profit margins. Interestingly, the AI investment boom is not visible in the Kalecki-Levy breakdown. This is partly because some capex is imported and leaks through the current account deficit, fueling the rising surplus and profits across Asia. The other reason is the NIPA accounts measure net investment with a stricter depreciation schedule than those reported in GAAP earnings and tax returns. Most of the gross investment boom has been netted away as AI investment is assumed to depreciate fast. Through this lens the capex boom is simply a transfer of profits from hyperscalers to the equipment providers. The useful life of GPUs and the extent to which depreciation eats into the net income of the hyperscalers remains to be seen. For now, we are tracking the rental indices for Nvidia A100 and H100 GPUs which peaked in September.

US-Kalecki-Levy Profits Decomposition - % of Gross National Product
US-Kalecki-Levy Profits Decomposition % of Gross National Product​ chart
Source: Refinitiv Datastream
Despite the stricter measurement of net investment, it’s clear the record profit share of GNP is being driven by the fiscal deficit and falling household savings in the US. Both of these channels appear unsustainable and exhibit some classic Minskyian traits. Fiscal policy has turned procyclical, with a 6% deficit boosting corporate profits in a full employment economy. In particular, the extension of 100% bonus depreciation in the One Big Beau-tiful Bill Act, allows companies to expense 100% of capex and pull forward tax deductions. This means cash taxes fall (and the fiscal deficit grows) during the boom. As capex slows (it must eventually), taxable income and cash taxes rise, creating an au-tomatic fiscal tightening right as the cycle slows.
Similarly, household dissaving rests on the wealth effect. The top decile spends against portfolio gains, which becomes corporate profits, which encourages further spending and so on…until stock prices stop rising and the cycle reverses.

As for the rest of the world, Kalecki drivers explain the profit trends exhibited in market indices. Asia has been driven by record current account surpluses. Within the Euro Area, Germany’s widening fiscal deficit is offsetting rising public saving. The current account surplus has shrunk slightly as the industrial sector loses out to China. If one consolidates the central bank into the government sector, the negative income booked by most central banks (since the 2022 rate hiking cycle) is a direct transfer of positive interest income on reserves boosting banking sector profits.

Stocks vs Bonds

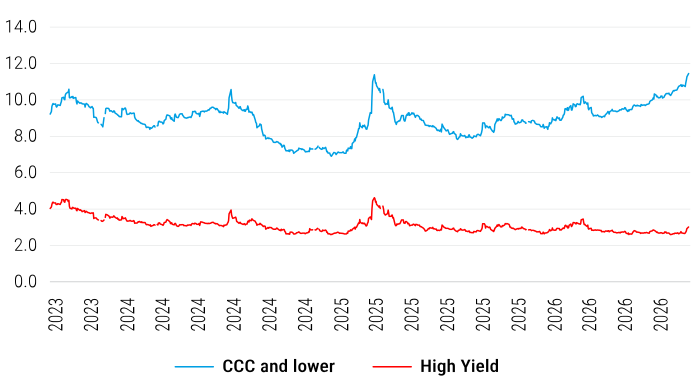
The sharp rise in bond yields has sparked a debate as to the causes behind the move and whether there’s anything to worry about. The Miran view, as we flagged last month claims rising yields reflect rising expectations of the policy rate which reflects higher growth expectations. The Druckenmiller view highlights bloated fiscal deficits alongside the recent splurge in AI related debt issuance. Real rates have simply adjusted higher as investment demand outpaces the supply of savings. Of course, borrowing to fund AI investment could spark a productivity revival and lift growth down the line. The same argument surely cannot be made for fiscal borrowing to fund interest payments, defence expenditures and entitlements. Whilst we await this elusive productivity boom, rates have repriced immediately, and we are seeing some very early signs of pressure emerging amongst the weakest borrowers.

Corporate Credit Spreads %
Corporate Credit Spreads chart

Source: Refinitiv Datastream

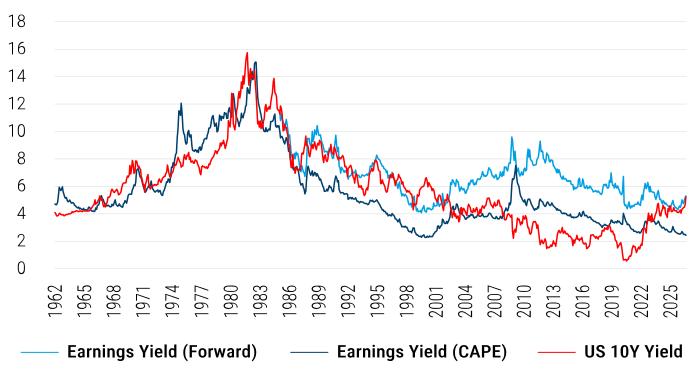
It’s a good time to review the so-called ‘Fed model’ which compares the stock market’s earnings yield (inverse PE) with the yield on the 10-year Treasury. The gap between the two is a rough and ready equity risk premium: the extra compensation investors receive for the uncertainty of profits over the ‘certainty’ of a government coupon.

US - Earnings Yield vs US 10Y Treasury Yield %
US Earnings Yield vs US 10Y Treasury Yield chart

Source: Refinitiv Datastream

For most of the past two decades this was comfortably in positive territory. With a 10- year yield at 5.3%, equities now look very expensive or slightly expensive vs bonds depending on the earnings you estimate. Forward earnings, which reflect fiscally driven record high margins as discussed above, are offering no risk premium above treasuries (both around 5.3%). A cyclically adjusted earnings yield around 2.5% leaves a -2.8% equity risk premium taking us back to 2000 levels. The model does mix a nominal bond yield against equities which can offer a shield against inflation. However, even a 10-year TIPS yield at 2.9% leaves a negative equity risk premium if one looks at cyclically adjusted earnings.

The Yen cannot be rescued by intervention alone

The Japanese yen looks like a currency waiting to recover. It is historically cheap (37% undervalued relative to the US Dollar according to our analysis), Japan remains a major external creditor, and inflation has replaced deflation as the country’s central economic challenge. Yet undervaluation alone is not enough to make a currency appreciate. Until the incentives facing global investors change, intervention can interrupt yen weakness, but it cannot reverse it sustainably.
That limitation became clear after the United States and Japan jointly purchased yen on 31 July 2026. The operation lifted the currency from around ¥164 against the dollar to approximately ¥156, but the yen soon slipped back towards ¥160. It was a strong demonstration of intent, but also of the market’s ability to reassert the underlying trend.
The central problem is the interest-rate differential. If investors can borrow cheaply in yen and earn higher returns in dollars, the yen will remain a popular funding currency. Indeed, Japanese investors bought more than ¥5 trillion of overseas assets in the two weeks following the intervention.
American participation nevertheless makes strategic sense. Excessive yen weakness disadvantages US manufacturers, places pressure on other Asian currencies and could destabilise global bond markets. Japan held approximately $1.1 trillion of US Treasuries in May 2026, meaning disorderly Japanese asset sales could push US borrowing costs higher. Supporting the yen is therefore partly an exercise in American self-interest.
Further intervention remains viable, but its purpose should be understood correctly. It can deter speculative positioning, introduce two-way risk and prevent a disorderly currency decline. What it cannot do is establish a permanently stronger exchange rate while monetary policy points in the opposite direction.
JPY support needs the rate gap to narrow
JPY support needs the rate gap to narrow​

Source: Refinitiv Datastream

A durable yen recovery requires the Bank of Japan to raise rates, the Federal Reserve to ease, or Japanese investors to hedge and repatriate more of their overseas assets. Intervention can amplify those changes, but it cannot substitute for them. The Bank of Japan hiked rates by 0.25% to 1.25% in September but the yen weakened as two members voted against the hike, casting doubt on the appetite for further tightening.
The yen may be fundamentally cheap, but cheap currencies need catalysts. Washington can provide the spark. Only a narrowing interest-rate gap can support a recovery.

The Final Word

Geopolitical risk has always been a factor lurking in the background of investors’ minds. Equity markets were able to shake off the initial bumpiness around the Russia-Ukraine war now nearing its 5th year. A similar pattern emerged in the aftermath of the US-Israel-Iran war which has so far lasted 7 months. We do, however, appear to be nearing an inflection point. The damage to refineries in both Russia and the Middle East, as well as the ongoing disruption to traffic in the Strait of Hormuz and Bab al Mandab, has driven up the oil price which has contributed to the bond sell-off. Oil pushing decisively past $100 and yields above 5% surely spell trouble for economic growth, profits and the stock market.


On the other hand, it’s worth considering the alternative scenario, particularly when it entails asymmetric payoffs. As unlikely as it currently seems, and at risk of stating the obvious, a resolution to both conflicts would represent a game-changing outcome for markets. Oil prices would collapse, easing concerns around inflation and bond yields, delivering a significant tailwind to risk assets. One would expect Europe and particularly Eastern Europe to rip on such news.
With the US midterms around the corner, perhaps there is a glimmer of hope for a much-needed peace dividend. If no progress is made, and oil continues to rally, investors should prepare for an ugly end to the year.

Key topics

Subscribe to insights

Get the most out of your email by tailoring the types of insights and information you would like to receive from us.

Latest articles

Retail parks are uniquely positioned at the intersection of three structural forces: value-oriented consumer behaviour, demand for convenience, and a constrained supply pipeline. We assess the outlook for one of the UK’s most structurally supported real estate sub-sectors.
Explore Pyrford's Q3 2026 investment outlook covering bond yields, equity valuations, corporate profits and market risks.
Inflation continues to influence government finances, with UK real yields nearing 2%, their highest level since 2008, and US real yields approaching 3%.
Key topics
Related topics

1https://www.levyforecast.com/assets/Profits.pdf

Important information

For use by professional clients and/or equivalent investor types in your jurisdiction (not to be used with or passed on to retail clients).

This document is intended for informational purposes only and should not be considered representative of any particular investment. This should not be considered an offer or solicitation to buy or sell any securities or other financial instruments, or to provide investment advice or services. Investing involves risk including the risk of loss of principal. Your capital is at risk. Market risk may affect a single issuer, sector of the economy, industry or the market as a whole. The value of investments is not guaranteed, and therefore an investor may not get back the amount invested. International investing involves certain risks and volatility due to potential political, economic or currency fluctuations and different financial and accounting standards. The securities included herein are for illustrative purposes only, subject to change and should not be construed as a recommendation to buy or sell. Securities discussed may or may not prove profitable.

The views expressed are as of the date given, may change as market or other conditions change and may differ from views expressed by other Columbia Threadneedle Investments (Columbia Threadneedle) associates or affiliates. Actual investments or investment decisions made by Columbia Threadneedle and its affiliates, whether for its own account or on behalf of clients, may not necessarily reflect the views expressed. This information is not intended to provide investment advice and does not take into consideration individual investor circumstances. Investment decisions should always be made based on an investor’s specific financial needs, objectives, goals, time horizon and risk tolerance. Asset classes described may not be suitable for all investors. Past performance does not guarantee future results, and no forecast should be considered a guarantee either. Information and opinions provided by third parties have been obtained from sources believed to be reliable, but accuracy and completeness cannot be guaranteed. This document and its contents have not been reviewed by any regulatory authority.

In the UK: Issued by Pyrford International Limited, which is authorised and regulated by the Financial Conduct Authority.

In the EEA: Issued by Columbia Threadneedle Netherlands B.V., which is regulated by the Dutch Authority for the Financial Markets (AFM).

In Switzerland: Issued by Threadneedle Portfolio Services AG, Registered address: Claridenstrasse 41, 8002 Zurich, Switzerland.

In the Middle East: This document is distributed by Columbia Threadneedle Investments (ME) Limited, which is regulated by the Dubai Financial Services Authority (DFSA). For Institutional Clients: The information in this document is not intended as financial advice and is only intended for persons with appropriate investment knowledge and who meet the regulatory criteria to be classified as a Professional Client or Market Counterparties and no other Person should act upon it. This document and its contents and any other information or opinions subsequently supplied or given to you are strictly confidential and for your sole use only and not for further distribution. By accepting delivery of this presentation, you agree that it is not to be copied or reproduced in whole or in part and that you will not disclose its contents to any other person. For Distributors: This document is intended to provide distributors with information about Group products and services and is not for further distribution.

In the USA: Pyrford International Ltd, registered by the U.S. Securities and Exchange Commission as an Investment Adviser.

In Singapore: Issued by Threadneedle Investments Singapore (Pte.) Limited, 3 Killiney Road, #07-07, Winsland House 1, Singapore 239519, which is regulated in Singapore by the Monetary Authority of Singapore under the Securities and Futures Act (Chapter 289). Registration number: 201101559W. This advertisement has not been reviewed by the Monetary Authority of Singapore.

In Hong Kong: Issued by Threadneedle Portfolio Services Hong Kong Limited 天利投資管理香港有限公司. Unit 3004, Two Exchange Square, 8 Connaught Place, Hong Kong, which is licensed by the Securities and Futures Commission (“SFC”) to conduct Type 1 regulated activities (CE: AQA779). Registered in Hong Kong under the Companies Ordinance (Chapter 622), No. 1173058.

In Canada: Pyrford relies upon the “International Adviser Exemption” in subsection 8.26 of National Instrument 31-103 Registration Requirements, Exemptions and Ongoing Registrant Obligations to advise “permitted clients” in Alberta, British Columbia, Manitoba, Ontario and Quebec.

In Australia: Issued by Threadneedle Investments Singapore (Pte.) Limited [“TIS”], ARBN 600 027 414. TIS is exempt from the requirement to hold an Australian financial services licence under the Corporations Act 2001 (Cth) and relies on Class Order 03/1102 in respect of the financial services it provides to wholesale clients in Australia. This document should only be distributed in Australia to ‘wholesale clients’ as defined in Section 761G of the Corporations Act. TIS is regulated in Singapore (Registration number: 201101559W) by the Monetary Authority of Singapore under the Securities and Futures Act (Chapter 289), which differ from Australian laws.

Pyrford International Ltd is a wholly owned subsidiary of Columbia Threadneedle Investments UK International Limited, whose direct parent is Ameriprise Financial Inc., a company incorporated in the United States.

Related Insights

12 October 2026

Senior Economist, Multi-Asset Solutions team

Market Perspectives: Why is oil stuck at $100/barrel?

Oil markets have received some comparatively encouraging signals from the Middle East, but the improvement in physical supply has yet to translate into a decisive fall in prices.
5 October 2026

Senior Economist, Multi-Asset Solutions team

Market Perspectives: Déjà vu – another bond sequel

Government bond yields are rising again – but this is not simply a repeat of 2022. We consider what fiscal pressures, inflation uncertainty and higher borrowing costs could mean for bonds, equities and portfolio positioning.
28 September 2026

Senior Economist, Multi-Asset Solutions team

Market Perspectives: What’s in store for Q4?

Four factors are likely to have an important bearing on financial markets in the fourth quarter of 2026: US politics, fiscal policy in the UK and France, developments involving Iran, and the corporate earnings outlook.
15 October 2026

The case for UK retail parks

Retail parks are uniquely positioned at the intersection of three structural forces: value-oriented consumer behaviour, demand for convenience, and a constrained supply pipeline. We assess the outlook for one of the UK’s most structurally supported real estate sub-sectors.
13 October 2026

In Credit Weekly Snapshot – The real thing

Inflation continues to influence government finances, with UK real yields nearing 2%, their highest level since 2008, and US real yields approaching 3%.
12 October 2026

Senior Economist, Multi-Asset Solutions team

Market Perspectives: Why is oil stuck at $100/barrel?

Oil markets have received some comparatively encouraging signals from the Middle East, but the improvement in physical supply has yet to translate into a decisive fall in prices.

Important information

For use by professional clients and/or equivalent investor types in your jurisdiction (not to be used with or passed on to retail clients).

This document is intended for informational purposes only and should not be considered representative of any particular investment. This should not be considered an offer or solicitation to buy or sell any securities or other financial instruments, or to provide investment advice or services. Investing involves risk including the risk of loss of principal. Your capital is at risk. Market risk may affect a single issuer, sector of the economy, industry or the market as a whole. The value of investments is not guaranteed, and therefore an investor may not get back the amount invested. International investing involves certain risks and volatility due to potential political, economic or currency fluctuations and different financial and accounting standards. The securities included herein are for illustrative purposes only, subject to change and should not be construed as a recommendation to buy or sell. Securities discussed may or may not prove profitable.

The views expressed are as of the date given, may change as market or other conditions change and may differ from views expressed by other Columbia Threadneedle Investments (Columbia Threadneedle) associates or affiliates. Actual investments or investment decisions made by Columbia Threadneedle and its affiliates, whether for its own account or on behalf of clients, may not necessarily reflect the views expressed. This information is not intended to provide investment advice and does not take into consideration individual investor circumstances. Investment decisions should always be made based on an investor’s specific financial needs, objectives, goals, time horizon and risk tolerance. Asset classes described may not be suitable for all investors. Past performance does not guarantee future results, and no forecast should be considered a guarantee either. Information and opinions provided by third parties have been obtained from sources believed to be reliable, but accuracy and completeness cannot be guaranteed. This document and its contents have not been reviewed by any regulatory authority.

In the UK: Issued by Pyrford International Limited, which is authorised and regulated by the Financial Conduct Authority.

In the EEA: Issued by Columbia Threadneedle Netherlands B.V., which is regulated by the Dutch Authority for the Financial Markets (AFM).

In Switzerland: Issued by Threadneedle Portfolio Services AG, Registered address: Claridenstrasse 41, 8002 Zurich, Switzerland.

In the Middle East: This document is distributed by Columbia Threadneedle Investments (ME) Limited, which is regulated by the Dubai Financial Services Authority (DFSA). For Institutional Clients: The information in this document is not intended as financial advice and is only intended for persons with appropriate investment knowledge and who meet the regulatory criteria to be classified as a Professional Client or Market Counterparties and no other Person should act upon it. This document and its contents and any other information or opinions subsequently supplied or given to you are strictly confidential and for your sole use only and not for further distribution. By accepting delivery of this presentation, you agree that it is not to be copied or reproduced in whole or in part and that you will not disclose its contents to any other person. For Distributors: This document is intended to provide distributors with information about Group products and services and is not for further distribution.

In the USA: Pyrford International Ltd, registered by the U.S. Securities and Exchange Commission as an Investment Adviser.

In Singapore: Issued by Threadneedle Investments Singapore (Pte.) Limited, 3 Killiney Road, #07-07, Winsland House 1, Singapore 239519, which is regulated in Singapore by the Monetary Authority of Singapore under the Securities and Futures Act (Chapter 289). Registration number: 201101559W. This advertisement has not been reviewed by the Monetary Authority of Singapore.

In Hong Kong: Issued by Threadneedle Portfolio Services Hong Kong Limited 天利投資管理香港有限公司. Unit 3004, Two Exchange Square, 8 Connaught Place, Hong Kong, which is licensed by the Securities and Futures Commission (“SFC”) to conduct Type 1 regulated activities (CE: AQA779). Registered in Hong Kong under the Companies Ordinance (Chapter 622), No. 1173058.

In Canada: Pyrford relies upon the “International Adviser Exemption” in subsection 8.26 of National Instrument 31-103 Registration Requirements, Exemptions and Ongoing Registrant Obligations to advise “permitted clients” in Alberta, British Columbia, Manitoba, Ontario and Quebec.

In Australia: Issued by Threadneedle Investments Singapore (Pte.) Limited [“TIS”], ARBN 600 027 414. TIS is exempt from the requirement to hold an Australian financial services licence under the Corporations Act 2001 (Cth) and relies on Class Order 03/1102 in respect of the financial services it provides to wholesale clients in Australia. This document should only be distributed in Australia to ‘wholesale clients’ as defined in Section 761G of the Corporations Act. TIS is regulated in Singapore (Registration number: 201101559W) by the Monetary Authority of Singapore under the Securities and Futures Act (Chapter 289), which differ from Australian laws.

Pyrford International Ltd is a wholly owned subsidiary of Columbia Threadneedle Investments UK International Limited, whose direct parent is Ameriprise Financial Inc., a company incorporated in the United States.

Icon checked

Thank you. You can now visit your preference centre​ to choose which insights you would like to receive by email.

Icon checked

Thank you. You can now visit your preference centre​ to choose which insights you would like to receive by email.