



Explore Pyrford's Q3 2026 investment outlook covering bond yields, equity valuations, corporate profits and market risks.
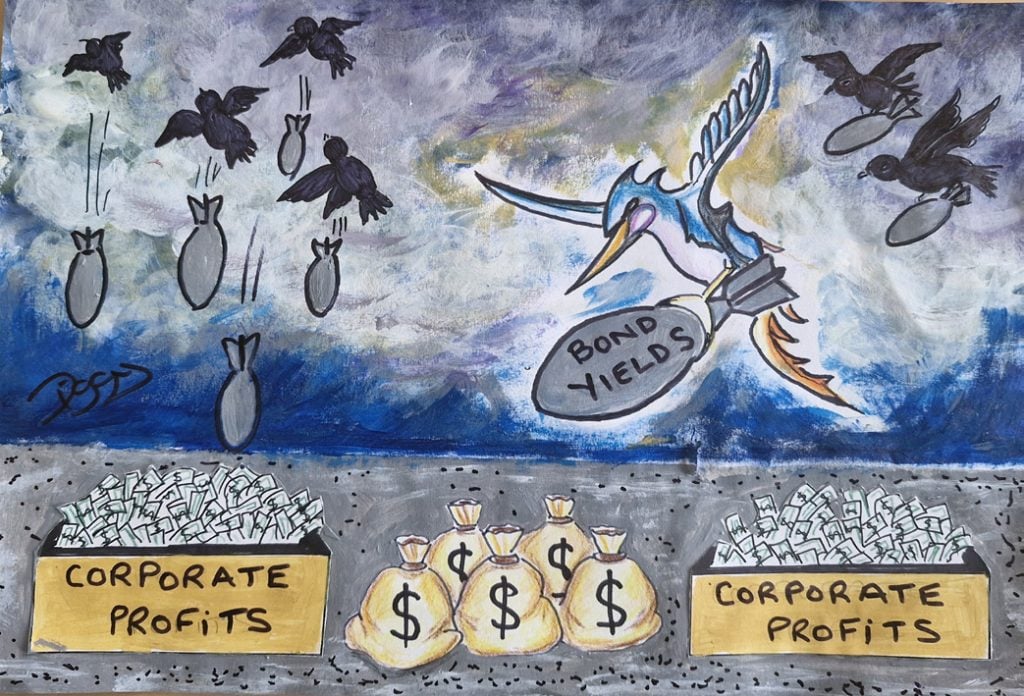
We’ve hit a fair few milestones this quarter. 5-and 10-year US Treasury yields have breached 5% amidst a global bond sell off. Year to date performance in USD on benchmark 10-year government bonds has been worst in France at -7.9% followed by Italy -7.4%, Germany -6.2%, US -4.3%, Canada, -4.2%, UK -3.4% and China the sole gainer at 7.1%. Brent oil has returned above $100 with prices of refined crude products like jet fuel, gasoline and diesel surging. Meanwhile, global equity markets continue to rally with MSCI ACWI, along with most indices across the major economies posting new highs in August or September.
Corporate Profits
The stock market rally has undoubtedly been driven by earnings.
MSCI ACWI rolling 12M Total Return Decomposition (%)
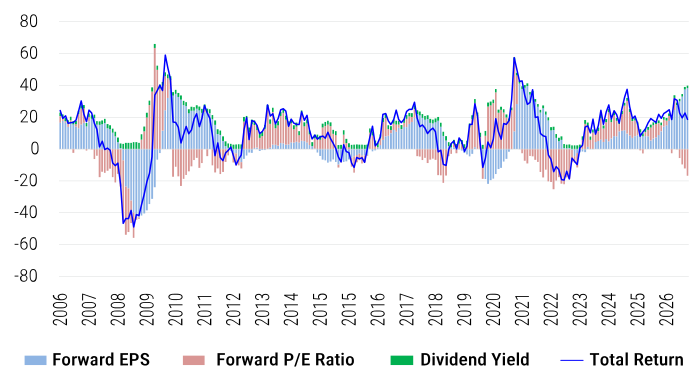
Estimates of 12m forward earnings have grown 38% over the last year for MSCI ACWI. Whilst the contributors to earnings and total returns have been heavily concentrated around tech hardware sectors particularly in the US, South Korea and Taiwan, 92% of all constituents in MSCI ACWI are expected to post positive earnings growth next year (against an average of 80%). Further, whilst analyst expectations are usually optimistic, they follow impressive trailing EPS growth which has grown 30% over the last year. This impressive EPS growth has been built off the back of record high profit margins around the world.
The US profit share of GNP measured in NIPA (National Income and Product Accounts) is at record highs matching the trend in listed profit margins. Interestingly, the AI investment boom is not visible in the Kalecki-Levy breakdown. This is partly because some capex is imported and leaks through the current account deficit, fueling the rising surplus and profits across Asia. The other reason is the NIPA accounts measure net investment with a stricter depreciation schedule than those reported in GAAP earnings and tax returns. Most of the gross investment boom has been netted away as AI investment is assumed to depreciate fast. Through this lens the capex boom is simply a transfer of profits from hyperscalers to the equipment providers. The useful life of GPUs and the extent to which depreciation eats into the net income of the hyperscalers remains to be seen. For now, we are tracking the rental indices for Nvidia A100 and H100 GPUs which peaked in September.
US-Kalecki-Levy Profits Decomposition - % of Gross National Product

As for the rest of the world, Kalecki drivers explain the profit trends exhibited in market indices. Asia has been driven by record current account surpluses. Within the Euro Area, Germany’s widening fiscal deficit is offsetting rising public saving. The current account surplus has shrunk slightly as the industrial sector loses out to China. If one consolidates the central bank into the government sector, the negative income booked by most central banks (since the 2022 rate hiking cycle) is a direct transfer of positive interest income on reserves boosting banking sector profits.
Stocks vs Bonds
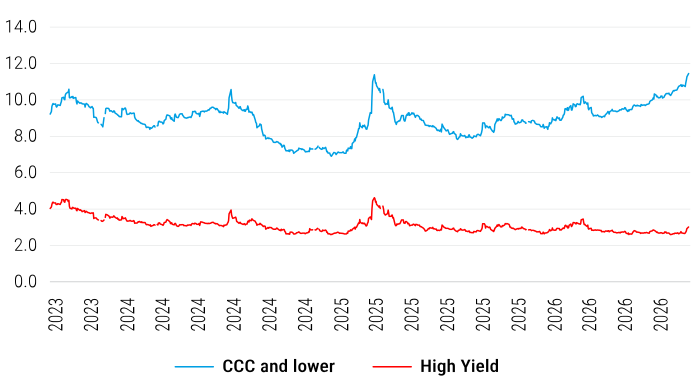
The sharp rise in bond yields has sparked a debate as to the causes behind the move and whether there’s anything to worry about. The Miran view, as we flagged last month claims rising yields reflect rising expectations of the policy rate which reflects higher growth expectations. The Druckenmiller view highlights bloated fiscal deficits alongside the recent splurge in AI related debt issuance. Real rates have simply adjusted higher as investment demand outpaces the supply of savings. Of course, borrowing to fund AI investment could spark a productivity revival and lift growth down the line. The same argument surely cannot be made for fiscal borrowing to fund interest payments, defence expenditures and entitlements. Whilst we await this elusive productivity boom, rates have repriced immediately, and we are seeing some very early signs of pressure emerging amongst the weakest borrowers.
Corporate Credit Spreads %
Source: Refinitiv Datastream
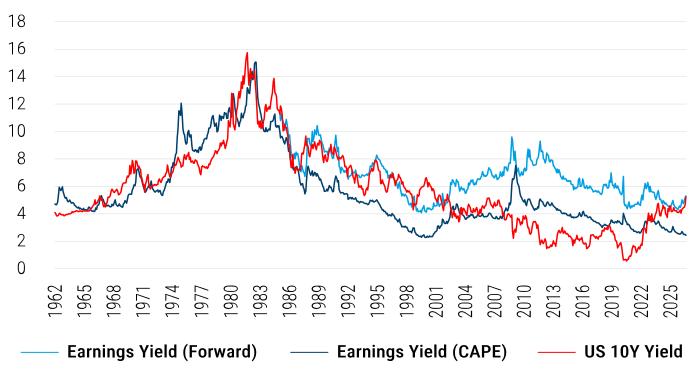
It’s a good time to review the so-called ‘Fed model’ which compares the stock market’s earnings yield (inverse PE) with the yield on the 10-year Treasury. The gap between the two is a rough and ready equity risk premium: the extra compensation investors receive for the uncertainty of profits over the ‘certainty’ of a government coupon.
US - Earnings Yield vs US 10Y Treasury Yield %
Source: Refinitiv Datastream
The Yen cannot be rescued by intervention alone
JPY support needs the rate gap to narrow

Source: Refinitiv Datastream
The Final Word
Geopolitical risk has always been a factor lurking in the background of investors’ minds. Equity markets were able to shake off the initial bumpiness around the Russia-Ukraine war now nearing its 5th year. A similar pattern emerged in the aftermath of the US-Israel-Iran war which has so far lasted 7 months. We do, however, appear to be nearing an inflection point. The damage to refineries in both Russia and the Middle East, as well as the ongoing disruption to traffic in the Strait of Hormuz and Bab al Mandab, has driven up the oil price which has contributed to the bond sell-off. Oil pushing decisively past $100 and yields above 5% surely spell trouble for economic growth, profits and the stock market.