sg
SG
Singapore
en-SG
sg_retl_classes
intm
Intermediary
en
en
electric vehicle

World in Motion – Global equities blog

Electric Vehicle transition: poised to move through the gears

Joe Horrocks-Taylor
Joe Horrocks-Taylor
Senior Associate, Analyst, Responsible Investment
Neil Robson
Neil Robson
Head of Global Equities

Key Takeaways

  • The speed of electric vehicle adoption is varying by region. China is leading the way with rapid growth. Europe is picking up pace with sales up 30% in 2025 relative to 2024, but the US is lagging.
  • High prices have hampered growth, but advances in battery technology and production efficiency gains mean costs are expected to decrease by 20% by 2027. Near-parity with combustion engine vehicles is on the horizon.
  • In China and Europe there is strong policy support for electric vehicles – China has extended its $11bn cash-for-clunkers scheme. There is less impetus in the US from a policy perspective.
  • Chinese automakers are well placed to capture market share – a function of their technological and cost advantages. We are looking to tap into related opportunities in select portfolios.

Early market optimism on the electric vehicle (EV) transition has faded over the last two years as growth rates in Europe and the US have stalled. Today we can see a three-speed global EV market: China is surging ahead, Europe is showing renewed momentum, and the US is stuck in the slow lane. Over the last few months, we have conducted a research project to appraise the factors that we see dictating the pace of the EV transition: the ability of technology developments to reduce upfront EV costs, the degree of policy support by market, how Chinese competition will influence the market, and the pace of EV charger deployment. Our research indicates that while significant barriers to EV adoption persist, the industry is approaching several critical inflection points that could accelerate the transition to electric mobility.

EV adoption: full speed ahead in China, Europe shifts gears, US idles

The global EV landscape shows distinct regional patterns, with China leading the charge, Europe following and the US slower to adopt. In 2023 and 2024 EV adoption in Europe and the US flatlined. However, Europe has shown strong momentum in early 2025, with EV sales up 30% compared to the previous year. This trajectory suggests European EV penetration could reach 19-20% by year-end, driven by the introduction of more affordable options in previously untapped market segments. The US market presents a more challenging picture, with EV penetration expected to remain around 10% in 2025. However, there may be a short-term boost in sales as consumers rush to take advantage of tax credits before their phase-out. China continues to dominate global EV adoption, with battery electric vehicles (BEVs) expected to reach 30% market penetration by 2025. When including hybrids and extended-range electric vehicles (EREVs), the total electrified vehicle share in China
could approach 60% by 2025.

Our analysis suggests that EV costs will reduce by 2027 to near ICEV parity

Driven by expensive powertrains and high overheads, high EV production costs are the primary barrier to adoption. While EVs in the US and the European Union (EU) still command a 20-25% premium over their internal combustion engine vehicle (ICEV) counterparts, China has already achieved price parity, with EVs often pricing below comparable ICE vehicles. High costs stymie EV adoption by putting off potential customers. This prevents automakers from being able to produce budget vehicles, makes EVs more dependent on subsidies and raises insurance costs and depreciation rates.

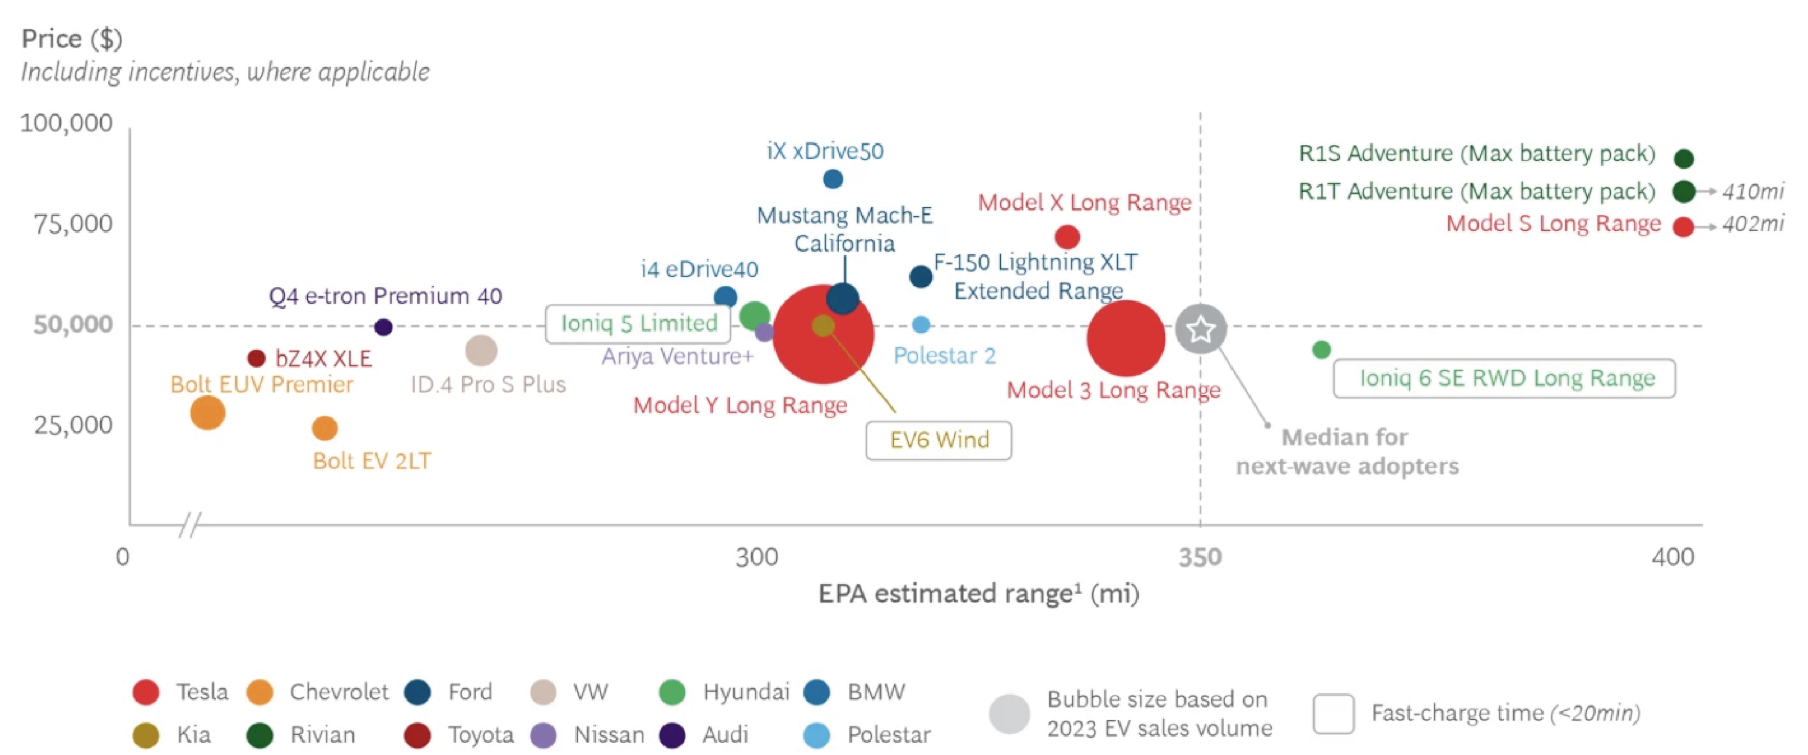
Figure 1: Only one EV on the market in the US meets customers, median price, range and charging time needs
Source: BCG, 20241

We estimate that over 80% of this cost gap between EVs and ICEVs is driven by higher powertrain and overhead costs. The difference in powertrain costs is primarily driven by expensive EV batteries, while higher overhead costs per unit stem from high EV research & development (R&D) expenses, lower sales volumes and lower utilisation rates of production facilities.

Figure 2: Comparing EV and ICEV costs for US economy passenger cars, using 2022 cost base. The bottom table shows the proportion of the 18% cost difference that is attributed to each cost item difference
EV, ICEV

Sources: BNEF, ICCT, Columbia Threadneedle analysis2

We identified 16 cost reduction levers that automakers are using to reduce EV upfront costs and grouped these into four buckets (see Figure 3).

1) Reduced range anxiety – improve EV charging speed and provision to ameliorate range anxiety concerns, which reduces the size and cost of the vehicle battery pack.
2) Vehicle efficiency – enhance vehicle efficiency by improving aerodynamics and lowering vehicle weight, which also reduces the size and cost of the vehicle
battery pack.
3) Lower battery costs – reduce battery pack costs directly by adopting different sourcing models for batteries and critical minerals, adjusting the battery chemistries used and streamlining battery packing.
4) Limit non-battery costs – increase volumes and reduce costs such as manufacturing, overheads and powertrain costs.

We conducted a bottom-up analysis of how these levers can lower EV costs, using a combination of data and analysis from academia, industry and collaboration with our fundamental analysts. We then assessed how much of this potential cost
reduction could be realised in the next two to three years with new EV platform releases.

We estimate that EV costs will come down by approximately 20% by 2027, bringing EVs close to cost parity with ICEVs. We project that adjustments to battery chemistries, enhancements of battery pack densities and improvements of powertrain cost efficiency could have the largest impacts on lowering EV costs.

Figure 3: Evaluating levers to reduce EV costs by 2027 for Western OEMs
EV costs
Cost
%
Indirect overhead
8.20%
Powertrain
7.10%
Body
1.60%
Electronics
0.80%
Chassis
0.40%
Interior
0.00%
Assembly labour costs
-0.20%

Source: Columbia Threadneedle

We expect policy support to continue driving EV penetration in China and Europe

The policy environment for EVs varies significantly across major markets. In Europe, recent changes to fleet emissions standards now allow manufacturers to average their compliance targets over 2025-2027, providing some flexibility for original equipment manufacturers (OEMs) struggling with the transition. While this
may slightly slow EV penetration in the near term, other initiatives, such as potential corporate fleet electrification requirements, could provide new growth drivers.

China maintains strong regulatory support for EVs, with a significant $11 billion cash-for-clunkers scheme extension for 2025 that could support approximately 1.1 million new BEV sales. This represents about 20% of BEV sales and could be further
enhanced by additional economic stimulus measures.

The US policy landscape has become less supportive. The likely phase-out of point-of-purchase EV credits will impact major manufacturers, particularly affecting Tesla, GM, and Ford through the 30D credit removal, and European manufacturers through the 45W credit phase-out. While the 45X battery manufacturer credit is expected to continue, the freezing of vehicle emissions standards at 2020-2021 levels will also slow electrification.

Chinese EV makers still have a competitive edge and will increasingly take market share

Chinese automakers have very competitive EV product offerings on both a technology and a cost basis. The recent Shanghai auto show demonstrated that Western automakers are frantically looking to leverage R&D and partnerships in
China to bridge the gap, but leading Chinese companies will continue to have an advantage over the short term.

We expect Chinese automakers to gain most share in Southeast Asia and the Middle East, where auto import tariffs are lower and there are no domestic champions to protect. Japanese OEMs are already losing significant share in these
markets. In contrast, Russia, Mexico and Brazil have been significant export markets in recent years, but are raising their import tariffs, which will strengthen incentives for Chinese automakers to localise production.

In Europe we see significant hurdles to Chinese automakers rapidly gaining share, contrary to some market projections. EU tariffs introduced in 2024 have already caused Chinese auto exports to the EU to decline by 7%. We also see EU efforts to encourage Chinese EV technology sharing and forthcoming cybersecurity rules as additional barriers. In addition, production plans by Chinese manufacturers in Europe have flattered to deceive, with only BYD and Geely committing to produce significant volumes to date.

Neil Robson
Neil Robson
Head of Global Equities

Stock spotlight

BYD: driving innovation forward and costs down

We maintain a strong conviction in BYD’s market position and growth potential, and have initiated or expanded positions in the company in several of our funds this year. BYD’s exceptional vertical integration capabilities create substantial cost advantages and supply chain resilience, setting it apart from competitors. BYD’s technological leadership is supported by
its massive R&D team of 110,000 engineers, and is evidenced by breakthrough innovations like its five minute charging technology for 400km range and the standardisation of its God’s Eye intelligent driving system across its mass-market vehicle lineup. The company’s strategic approach to global expansion, particularly its early moves to establish local production
facilities in Hungary, Turkey, Brazil, and planned operations in Mexico, positions it uniquely among Chinese automakers to navigate international trade barriers. This manufacturing flexibility, combined with its technological edge and cost leadership, makes BYD particularly well-equipped to capture market share in both developed and emerging markets.

The mention of any specific shares should not be taken as a recommendation to deal.

EV charging surging in China and Europe

As EV upfront costs continue to fall, we see charging becoming the main barrier to EV penetration. However, the outlook for EV charging is positive, particularly in China and Europe. China accounted for 68% of installed EV charging capacity by the end of 2024 with charger deployment keeping pace with EV sales, while efforts by BYD and CATL has slashed top-end charging times to five minutes. Europe has made substantial progress, reaching one million public chargers in 2025, with installation rates growing at 33% year-over-year. Particularly encouraging is the rapid expansion of ultra-fast chargers, which represented 20% of new installations in 2024, with installation rates doubling annually. Recent improvements have been driven by a notable decline in the prices of fast chargers, with costs falling by 80% since 2020. The outlook for the US is less positive, with only 4,000 public chargers installed in Q4 2024 and the pause in Federal charging funds under the new administration set to slow deployment.

The bottom line

The EV landscape is evolving rapidly, with the swift pace of technological innovation shifting competitive advantages. While we do not expect the transition to move at the same pace globally, and we continue to see charging infrastructure as the largest barrier, the steady march towards vehicle electrification appears irreversible. Chinese manufacturers, especially BYD, are well-positioned to capitalise on this transition with their strong technological advantages and low-cost bases, though their success in different markets will vary based on local conditions and trade policies. We do think that there is space for the best Western automakers to succeed when they combine a precise focus on key technologies with strategic flexibility.

Key topics

Subscribe to insights

Get the most out of your email by tailoring the types of insights and information you would like to receive from us.

Latest articles

With cost parity on the horizon, we expect the adoption of electric vehicles to accelerate. We explore the key drivers and related investment opportunities.
Japanese equities have enjoyed strong returns in recent years. Have investors missed the boat? We think not and remain constructive on the outlook from here.
Bumper earnings have seen big US tech names dominate equity returns. What are their prospects from here and will the rest of the market begin to close the gap?
Key topics
Related topics

1 https://www.bcg.com/publications/2024/can-oems-catch-the-next-wave-of-ev-adopters

2 https://www.bcg.com/publications/2024/can-oems-catch-the-next-wave-of-ev-adopters

Important Information

For use by professional clients and/or equivalent investor types in your jurisdiction (not to be used with or passed on to retail clients). For marketing purposes.
This document is intended for informational purposes only and should not be considered representative of any particular investment. This should not be considered an offer or solicitation to buy or sell any securities or other financial instruments, or to provide investment advice or services. Investing involves risk including the risk of loss of principal. Your capital is at risk. Market risk may affect a single issuer, sector of the economy, industry or the market as a whole. The value of investments is not guaranteed, and therefore an investor may not get back the amount invested. International investing involves certain risks and volatility due to potential political, economic or currency fluctuations and different financial and accounting standards. The securities included herein are for illustrative purposes only, subject to change and should not be construed as a recommendation to buy or sell. Securities discussed may or may not prove profitable. The views expressed are as of the date given, may change as market or other conditions change and may differ from views expressed by other Columbia Threadneedle Investments (Columbia Threadneedle) associates or affiliates. Actual investments or investment decisions made by Columbia Threadneedle and its affiliates, whether for its own account or on behalf of clients, may not necessarily reflect the views expressed. This information is not intended to provide investment advice and does not take into consideration individual investor circumstances. Investment decisions should always be made based on an investor’s specific financial needs, objectives, goals, time horizon and risk tolerance. Asset classes described may not be suitable for all investors. Past performance does not guarantee future results, and no forecast should be considered a guarantee either. Information and opinions provided by third parties have been obtained from sources believed to be reliable, but accuracy and completeness cannot be guaranteed. This document and its contents have not been reviewed by any regulatory authority.
In Australia: Issued by Threadneedle Investments Singapore (Pte.) Limited [“TIS”], ARBN 600 027 414. TIS is exempt from the requirement to hold an Australian financial services licence under the Corporations Act 2001 (Cth) and relies on Class Order 03/1102 in respect of the financial services it provides to wholesale clients in Australia. This document should only be distributed in Australia to “wholesale clients” as defined in Section 761G of the Corporations Act. TIS is regulated in Singapore (Registration number: 201101559W) by the Monetary Authority of Singapore under the Securities and Futures Act (Chapter 289), which differ from Australian laws.
In Singapore: Issued by Threadneedle Investments Singapore (Pte.) Limited, 3 Killiney Road, #07-07, Winsland House 1, Singapore 239519, which is regulated in Singapore by the Monetary Authority of Singapore under the Securities and Futures Act (Chapter 289). Registration number: 201101559W. This advertisement has not been reviewed by the Monetary Authority of Singapore.
In Hong Kong: Issued by Threadneedle Portfolio Services Hong Kong Limited 天利投資管理香港有限公司. Unit 3004, Two Exchange Square, 8 Connaught Place, Hong Kong, which is licensed by the Securities and Futures Commission (“SFC”) to conduct Type 1 regulated activities (CE:AQA779). Registered in Hong Kong under the Companies Ordinance (Chapter 622), No. 1173058.
In Japan: Issued by Columbia Threadneedle Investments Japan Co., Ltd. Financial Instruments Business Operator, The Director-General of Kanto Local Finance Bureau (FIBO) No.3281, and a member of Japan Investment Advisers Association and Type II Financial Instruments Firms Association.
In the UK: Issued by Threadneedle Asset Management Limited, No. 573204 and/or Columbia Threadneedle Management Limited, No. 517895, both registered in England and Wales and authorised and regulated in the UK by the Financial Conduct Authority.
In the EEA: Issued by Threadneedle Management Luxembourg S.A., registered with the Registre de Commerce et des Sociétés (Luxembourg), No. B 110242 and/or Columbia Threadneedle Netherlands B.V., regulated by the Dutch Authority for the Financial Markets (AFM), registered No. 08068841.
In Switzerland: Issued by Threadneedle Portfolio Services AG, Registered address: Claridenstrasse 41, 8002 Zurich, Switzerland.
In the Middle East: This document is distributed by Columbia Threadneedle Investments (ME) Limited, which is regulated by the Dubai Financial Services Authority (DFSA). The information in this document is not intended as financial advice and is only intended for persons with appropriate investment knowledge who meet the regulatory criteria to be classified as a Professional Client or Market Counterparty and no other person should act upon it. This document and its contents and any other information or opinions subsequently supplied or given to you are strictly confidential and for the sole use of those attending the presentation. It may not be reproduced in any form or passed on to any third party without the express written permission of CTIME. By accepting delivery of this presentation, you agree that it is not to be copied or reproduced in whole or in part and that you will not disclose its contents to any other person.
This document may be made available to you by an affiliated company which is part of the Columbia Threadneedle Investments group of companies: Columbia Threadneedle Management Limited in the UK; Columbia Threadneedle Netherlands B.V., regulated by the Dutch Authority for the Financial Markets (AFM), registered No. 08068841.
Columbia Threadneedle Investments is the global brand name of the Columbia and Threadneedle group of companies.

Related Posts

12 February 2025

Japan’s economic revival – the first steps of a long-awaited transformation

Japanese equities have enjoyed strong returns in recent years. Have investors missed the boat? We think not and remain constructive on the outlook from here.
21 January 2025

A racing certainty – can big tech beat the odds again?

Bumper earnings have seen big US tech names dominate equity returns. What are their prospects from here and will the rest of the market begin to close the gap?
17 October 2024

Power hungry AI - investment implications in the era of energy transition

Understanding the options for power provision and assessing the investment opportunities resulting from AI’s thirst for energy.
1 July 2025

Fixed Income Desk

In Credit - Weekly Snapshot

In Credit Weekly Snapshot – June 2025

Our fixed income team provide their weekly snapshot of market events.
1 July 2025

Joe Horrocks-Taylor

Senior Associate, Analyst, Responsible Investment

Electric Vehicle transition: poised to move through the gears

With cost parity on the horizon, we expect the adoption of electric vehicles to accelerate. We explore the key drivers and related investment opportunities.
30 June 2025

Anthony Willis

Senior Economist

Market perspectives: What a difference a week makes

It has been another extraordinary week of geopolitical developments with the backdrop considerably more benign than a week ago thanks to a tentative ceasefire between Israel and Iran.

Important Information

For use by professional clients and/or equivalent investor types in your jurisdiction (not to be used with or passed on to retail clients). For marketing purposes.
This document is intended for informational purposes only and should not be considered representative of any particular investment. This should not be considered an offer or solicitation to buy or sell any securities or other financial instruments, or to provide investment advice or services. Investing involves risk including the risk of loss of principal. Your capital is at risk. Market risk may affect a single issuer, sector of the economy, industry or the market as a whole. The value of investments is not guaranteed, and therefore an investor may not get back the amount invested. International investing involves certain risks and volatility due to potential political, economic or currency fluctuations and different financial and accounting standards. The securities included herein are for illustrative purposes only, subject to change and should not be construed as a recommendation to buy or sell. Securities discussed may or may not prove profitable. The views expressed are as of the date given, may change as market or other conditions change and may differ from views expressed by other Columbia Threadneedle Investments (Columbia Threadneedle) associates or affiliates. Actual investments or investment decisions made by Columbia Threadneedle and its affiliates, whether for its own account or on behalf of clients, may not necessarily reflect the views expressed. This information is not intended to provide investment advice and does not take into consideration individual investor circumstances. Investment decisions should always be made based on an investor’s specific financial needs, objectives, goals, time horizon and risk tolerance. Asset classes described may not be suitable for all investors. Past performance does not guarantee future results, and no forecast should be considered a guarantee either. Information and opinions provided by third parties have been obtained from sources believed to be reliable, but accuracy and completeness cannot be guaranteed. This document and its contents have not been reviewed by any regulatory authority.
In Australia: Issued by Threadneedle Investments Singapore (Pte.) Limited [“TIS”], ARBN 600 027 414. TIS is exempt from the requirement to hold an Australian financial services licence under the Corporations Act 2001 (Cth) and relies on Class Order 03/1102 in respect of the financial services it provides to wholesale clients in Australia. This document should only be distributed in Australia to “wholesale clients” as defined in Section 761G of the Corporations Act. TIS is regulated in Singapore (Registration number: 201101559W) by the Monetary Authority of Singapore under the Securities and Futures Act (Chapter 289), which differ from Australian laws.
In Singapore: Issued by Threadneedle Investments Singapore (Pte.) Limited, 3 Killiney Road, #07-07, Winsland House 1, Singapore 239519, which is regulated in Singapore by the Monetary Authority of Singapore under the Securities and Futures Act (Chapter 289). Registration number: 201101559W. This advertisement has not been reviewed by the Monetary Authority of Singapore.
In Hong Kong: Issued by Threadneedle Portfolio Services Hong Kong Limited 天利投資管理香港有限公司. Unit 3004, Two Exchange Square, 8 Connaught Place, Hong Kong, which is licensed by the Securities and Futures Commission (“SFC”) to conduct Type 1 regulated activities (CE:AQA779). Registered in Hong Kong under the Companies Ordinance (Chapter 622), No. 1173058.
In Japan: Issued by Columbia Threadneedle Investments Japan Co., Ltd. Financial Instruments Business Operator, The Director-General of Kanto Local Finance Bureau (FIBO) No.3281, and a member of Japan Investment Advisers Association and Type II Financial Instruments Firms Association.
In the UK: Issued by Threadneedle Asset Management Limited, No. 573204 and/or Columbia Threadneedle Management Limited, No. 517895, both registered in England and Wales and authorised and regulated in the UK by the Financial Conduct Authority.
In the EEA: Issued by Threadneedle Management Luxembourg S.A., registered with the Registre de Commerce et des Sociétés (Luxembourg), No. B 110242 and/or Columbia Threadneedle Netherlands B.V., regulated by the Dutch Authority for the Financial Markets (AFM), registered No. 08068841.
In Switzerland: Issued by Threadneedle Portfolio Services AG, Registered address: Claridenstrasse 41, 8002 Zurich, Switzerland.
In the Middle East: This document is distributed by Columbia Threadneedle Investments (ME) Limited, which is regulated by the Dubai Financial Services Authority (DFSA). The information in this document is not intended as financial advice and is only intended for persons with appropriate investment knowledge who meet the regulatory criteria to be classified as a Professional Client or Market Counterparty and no other person should act upon it. This document and its contents and any other information or opinions subsequently supplied or given to you are strictly confidential and for the sole use of those attending the presentation. It may not be reproduced in any form or passed on to any third party without the express written permission of CTIME. By accepting delivery of this presentation, you agree that it is not to be copied or reproduced in whole or in part and that you will not disclose its contents to any other person.
This document may be made available to you by an affiliated company which is part of the Columbia Threadneedle Investments group of companies: Columbia Threadneedle Management Limited in the UK; Columbia Threadneedle Netherlands B.V., regulated by the Dutch Authority for the Financial Markets (AFM), registered No. 08068841.
Columbia Threadneedle Investments is the global brand name of the Columbia and Threadneedle group of companies.

You may also like

Investment approach

Teamwork defines us and is fundamental to our investment approach, which is structured to facilitate the generation, assessment and implementation of good, strong investment ideas for our portfolios.

Our funds

Columbia Threadneedle Investments has a comprehensive range of investment funds catering for a broad range of objectives.

Our capabilities

We offer a broad range of actively managed investment strategies and solutions covering global, regional and domestic markets and asset classes.

Thank you. You can now visit your preference centre to choose which insights you would like to receive by email.

To view and control which insights you receive from us by email, please visit your preference centre.

Woman listens to music through headphones
Play Video

CT Property Trust- Fund Manager Update

Sed ut perspiciatis unde omnis iste natus error sit voluptatem accusantium doloremque laudantium