


se
SE
Sweden
en-SE
se_intm_classes
intm
Intermediary
en
en
For use by professional clients and/or equivalent investor types in your jurisdiction (not to be used with or passed on to retail clients)
Close-up of an automated electronics manufacturing process, with robotic tools placing and soldering components onto a printed circuit board

Insights

Pyrspectives – Is it a bubble?

Luke Casey
Luke Casey
Senior Client Portfolio Manager, Head of Client Strategy

It’s hard to focus on any other topic but the unprecedented AI boom that has engulfed markets.

Almost four years on from the ‘GPT moment’ that kicked off the AI data centre build out, there are still no signs of a slowdown in investment. History offers no shortage of capital booms that ended in bust. From the railroad mania to the dot-com bubble to shale and China’s investment boom, all great capital buildouts often trace the same arc. That’s not to say they don’t leave us with better technology and higher living standards on the other end. AI’s imprint on society is permanent and undeniable, but as investors in the midst of one of the largest capital cycles ever, it is only prudent to ask whether the spending has outrun the returns
We assess the question above around four fault lines: hyperscaler financing, deal circularity and concentration, AI monetisation, and physical constraints.
Number 1 with dot afterwards
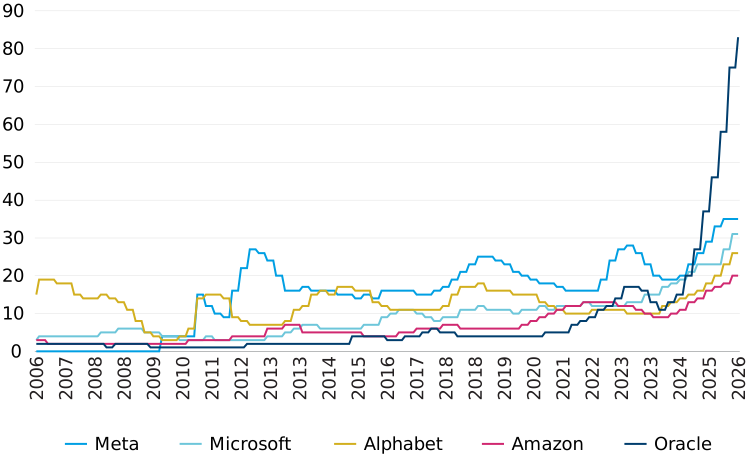
Hyperscaler financing: For years the hyperscalers (Alphabet, Amazon, Meta, Microsoft and now Oracle) funded their operations with internal cash flows and still returned billions to shareholders in the form of buybacks and dividends. That era is now ending with capex as a percent of sales at record highs ranging from 20% for Amazon to 83% for Oracle.
Hyperscaler Capex/Sales %*
Hyperscaler Capex Sales
Source: Refinitiv Datastream
* Capex understates true investment as it excludes operating and finance leases which have been used to procure data centre capacity
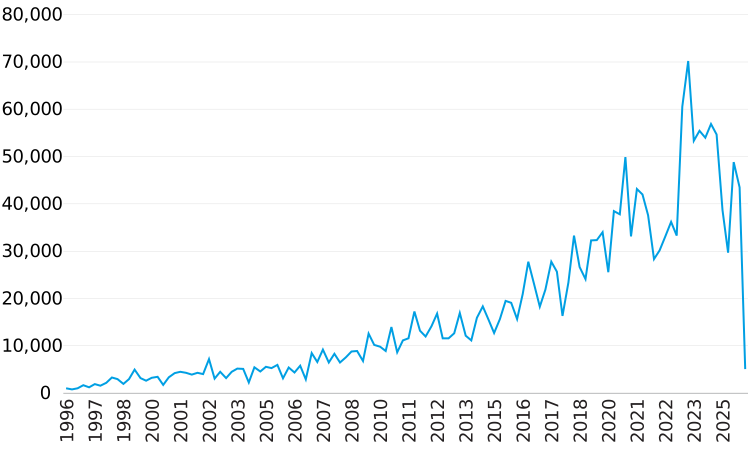
Free cash flow (operating cash flows minus capex) has vanished and rather than returning cash to shareholders the hyperscalers are now demanding cash in the form of equity and debt issuances
Hyperscaler Free Cash Flow (quarterly, $bn)
Hyperscaler Free Cash Flow
Source: Refinitiv Datastream
In the first 5 months of the year, they have issued $159bn of bonds, 47% more than all of last year. Notable equity issuances include $85bn from Alphabet and $25bn from Oracle this quarter.
Number 2 with dot afterwards
Deal circularity and concentration: Rather than dispersing into the broader economy, the billions being spent by the hyperscalers are circulating amongst a small interlocking set of players. Four direct customers make up 65% of Nvidia’s revenues up from 36% last year with the CFO stating that large cloud providers make up more than half of data centre revenue. Nvidia then recycles these profits, funding demand for its own chips through deals with OpenAI,xAI, Anthropic and various other neoclouds. The hyperscalers have also funded their own demand with Microsoft, Amazon and Google taking stakes in Anthropic, and Microsoft holding a 27% stake in OpenAI. Together, OpenAI and Anthropic make up more than half of the $2tn backlog across major cloud providers.1 This circularity has made demand appear more organic and durable than it is. Large bets have also concentrated on a few industry leaders today which could look very different tomorrow.
Number 3 with dot afterwards
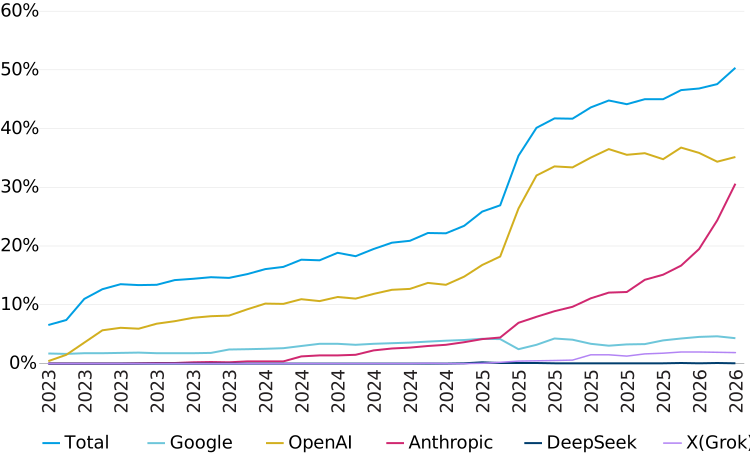
Monetisation: The problems around financing and circularity are all solved if AI demand is durable and profits can be captured by the likes of OpenAI and Anthropic. Here the bulls have a strong case. Revenue has grown exponentially with OpenAI and Anthropic reporting annualized revenue run rates of $25 billion and $30 billion respectively. According to the Ramp AI Index just over 50% of US businesses have a paid AI subscription.
Share of US Businesses with paid subscriptions to AI models, platforms and tools
Share of US Businesses with paid subscriptions to AI models
Source: Ramp AI Index
It is still unclear whether these enterprises are realising value as a result. Dated survey data reveals mixed results. The January 2026 Deloitte State of AI in Enterprise report claimed that 66% of organizations report that AI is successfully improving employee productivity while only 20% currently see a measurable impact on revenue.2 This follows a November 2025 MIT NANDA survey that stated 95% of generative AI pilots delivered zero measurable P&L impact.3
More importantly, even if enterprise demand is robust and long-term, what premium will model providers be able to charge in what is increasingly becoming a commoditized business? Here, the Chinese playbook is by now familiar. Pursue market share above near-term profits and win by delivering goods as good if not better than the incumbents’ at a fraction of the price. It has eaten the world’s lunch particularly in solar, EV’s and batteries and perhaps soon to be frontier AI.
The latest AI development this quarter was the release of Z.ai’s (formerly Zhipu AI) GLM-5.2 which almost matches the performance of Anthropic’s Opus 4.8 and Open AI’s GPT 5.5 and outperforms Google’s Gemini 3.5 at roughly onesixth the cost. On a related note, China has now also built the world’s most powerful supercomputer. The LineShine computer in Shenzhen displaced US computer El Capitan in the Top500 rankings released this month.4
For the bulk of enterprise AI there is likely no need to be at the frontier. Microsoft recently announced they were considering using cheaper DeepSeek models after AI bills soared.5 Data from OpenRouter suggests the model provider landscape has become highly fragmented.6
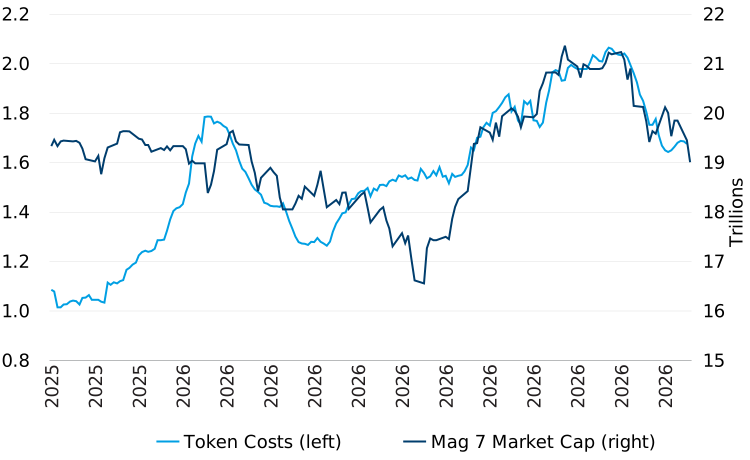
The rise of cheaper Chinese models, which are steadily gaining in performance has been behind the recent fall in token costs.
Silicon Data LLM Token Price Index and Magnificent 7 Market Cap

Source: Refinitiv Datastream

The chart above shows an expenditure weighted index of the blended price the market actually pays per million LLM tokens. It has a surprisingly tight fit with the MAG 7 over the last year, perhaps as a live tracker of the market’s willingness to pay for AI and hence the sustainability of the capex boom.
Ultimately, the moment of truth may arrive if and when Anthropic and OpenAI IPO and public markets finally weigh their real earning power against their vast compute commitments. Leaked financials from OpenAI show them losing a staggering $20.92bn in 2025 up from $8.78 in 2024.7
Number 4 with dot afterwards
Finally, the data centre build out has run into hard physical limits. In particular, a shortage of transformers and other electrical components has left 30-50% of 2026 data centre projects delayed or cancelled. 16 GW of capacity was planned for 2026 but only 5GW of capacity is under construction.8 This further complicates the return on investment picture for hyperscaler and various other neocloud capex. Whilst the spending and depreciation clock has begun, the revenue generating moment continues to be deferred. This again is hardly a problem for China which added 543 GW of power capacity in 2025. Cumulative additions to power capacity since 2021 exceed what the US has built in its entire history.9

USA! USA! USD! USD!

The most immediate catalyst of recent US Dollar strength has been the Federal Reserve’s shift under new chair Kevin Warsh. At his first meeting on 17 June, Warsh vowed to “deliver price stability”, and with 9 of the 18 Fed members seeing at least one hike this year, the Fed looks prepped to move should inflation continue to drift in the wrong direction. — a dramatic swing from March when no officials anticipated rises. The two-year Treasury yield surged to 4.22%, its highest in 16 months, as markets 25 bps increase by March next year.
US dollar versus US 2-year Treasury
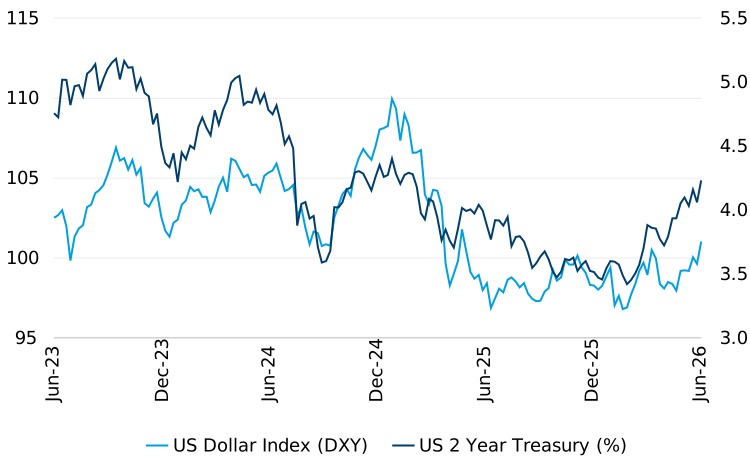

Source: Refinitiv Datastream

Underpinning the Fed’s stance is the strength of the US economy. The US added 172,000 jobs in May, more than double Wall Street expectations, and core inflation rose to 2.9%.
Bullish dollar bets in the futures market rose by the most since 2018 to their highest level in more than a year, driven partly by a renewed belief in US exceptionalism.
The conflict in the Middle East — which began at the end of February with the closure of the Strait of Hormuz — initially drove energy prices higher, boosting inflation in the US to above 4%. Although a US-Iran truce has since been signed, the dollar has remained firm. The Fed’s preferred headline PCE inflation gauge has risen to 3.8%, nearly double its 2% target. Many economists believe it is too late to stave off another bout of high inflation even if the Strait is fully reopened.
A key structural driver is the widening interest rate differential between the US and the rest of the world. In the Eurozone and UK — hit harder by the energy shock due to their dependence on imports — rate rise expectations have receded more quickly, as those economies face the prospect of slower growth. The buoyancy of US stock markets, boosted by SpaceX’s blockbuster IPO and enthusiasm around artificial intelligence, has also drawn investors back to the dollar.
But we need to put the recent move in context. The dollar rallied about 3% at the onset of the Iran conflict, but those gains have already faded. Part of the story is relative central bank positioning — with the ECB, BoJ and BoE all shifting more hawkishly than the Fed, the interest rate backdrop hasn’t been as supportive for the dollar as you might expect.

The Final Word

The UK is set to welcome its seventh Prime Minister in 10 years. Keir Starmer’s resignation, less than two years after a commanding 2024 victory, followed a steady erosion of political capital over the last few months. In particular local elections in May saw Labour’s national equivalent vote share fall to 17%, behind Reform UK at 26%. Andy Burnham, who served as mayor of Manchester from 2017 to 2026 looks most likely to replace Starmer in what is becoming an impossible job to keep. He inherits an economy with a tax share of GDP at 34% yet perpetually on the brink of a fiscal crisis. The UK has avoided recession primarily due to strong levels of population growth which have averaged 1.2% over the last 5 years but come at the cost of social backlash to immigration. Productivity growth meanwhile has been non-existent. Whether Burnham’s arrival brings some more ambitious plans for growth remains to be seen. Perhaps, with a bit of luck, an England World Cup victory is the spark the country needs to lift it out of its economic lull and bring about some much-needed optimism.

Key topics

Subscribe to insights

Get the most out of your email by tailoring the types of insights and information you would like to receive from us.

Latest articles

After an intense first half, financial markets appear to be entering a more measured phase.
Explore Pyrford's Q2 2026 market outlook, analysing the AI investment boom, hyperscaler capex, AI monetisation trends, data centre constraints, US dollar strength, inflation risks and global economic developments.
AI is reinforcing prime office demand in the short term, but the bigger question is whether productivity gains will ultimately limit hiring and space needs.
Key topics
Related topics

1 https://finance.yahoo.com/sectors/technology/articles/ai-bubblefears-grow-big-131548421.html?guccounter=1
2 The State of AI in the Enterprise – 2026 AI report | Deloitte UK
3 v0.1_State_of_AI_in_Business_2025_Report.pdf
4 Chinese supercomputer leapfrogs best US machines to be ranked
5 https://tech.yahoo.com/ai/copilot/articles/microsoft-eyesdeepseek-enterprise-ai-162740418.html
6 https://openrouter.ai/rankings
7 https://fortune.com/2026/06/16/openai-financials-leaked-lossesrevenue-profit/
8 U.S. AI Data Center Delays: 7 GW Capacity Crisis [2026]
9 https://www.bloomberg.com/news/articles/2026-02-04/chinaramps-up-energy-boom-flagged-by-musk-as-key-to-ai-race

Important information

For use by professional clients and/or equivalent investor types in your jurisdiction (not to be used with or passed on to retail clients).

This document is intended for informational purposes only and should not be considered representative of any particular investment. This should not be considered an offer or solicitation to buy or sell any securities or other financial instruments, or to provide investment advice or services. Investing involves risk including the risk of loss of principal. Your capital is at risk. Market risk may affect a single issuer, sector of the economy, industry or the market as a whole. The value of investments is not guaranteed, and therefore an investor may not get back the amount invested. International investing involves certain risks and volatility due to potential political, economic or currency fluctuations and different financial and accounting standards. The securities included herein are for illustrative purposes only, subject to change and should not be construed as a recommendation to buy or sell. Securities discussed may or may not prove profitable.

The views expressed are as of the date given, may change as market or other conditions change and may differ from views expressed by other Columbia Threadneedle Investments (Columbia Threadneedle) associates or affiliates. Actual investments or investment decisions made by Columbia Threadneedle and its affiliates, whether for its own account or on behalf of clients, may not necessarily reflect the views expressed. This information is not intended to provide investment advice and does not take into consideration individual investor circumstances. Investment decisions should always be made based on an investor’s specific financial needs, objectives, goals, time horizon and risk tolerance. Asset classes described may not be suitable for all investors. Past performance does not guarantee future results, and no forecast should be considered a guarantee either. Information and opinions provided by third parties have been obtained from sources believed to be reliable, but accuracy and completeness cannot be guaranteed. This document and its contents have not been reviewed by any regulatory authority.

In the UK: Issued by Pyrford International Limited, which is authorised and regulated by the Financial Conduct Authority.

In the EEA: Issued by Columbia Threadneedle Netherlands B.V., which is regulated by the Dutch Authority for the Financial Markets (AFM).

In Switzerland: Issued by Threadneedle Portfolio Services AG, Registered address: Claridenstrasse 41, 8002 Zurich, Switzerland.

In the Middle East: This document is distributed by Columbia Threadneedle Investments (ME) Limited, which is regulated by the Dubai Financial Services Authority (DFSA). For Institutional Clients: The information in this document is not intended as financial advice and is only intended for persons with appropriate investment knowledge and who meet the regulatory criteria to be classified as a Professional Client or Market Counterparties and no other Person should act upon it. This document and its contents and any other information or opinions subsequently supplied or given to you are strictly confidential and for your sole use only and not for further distribution. By accepting delivery of this presentation, you agree that it is not to be copied or reproduced in whole or in part and that you will not disclose its contents to any other person. For Distributors: This document is intended to provide distributors with information about Group products and services and is not for further distribution.

In the USA: Pyrford International Ltd, registered by the U.S. Securities and Exchange Commission as an Investment Adviser.

In Singapore: Issued by Threadneedle Investments Singapore (Pte.) Limited, 3 Killiney Road, #07-07, Winsland House 1, Singapore 239519, which is regulated in Singapore by the Monetary Authority of Singapore under the Securities and Futures Act (Chapter 289). Registration number: 201101559W. This advertisement has not been reviewed by the Monetary Authority of Singapore.

In Hong Kong: Issued by Threadneedle Portfolio Services Hong Kong Limited 天利投資管理香港有限公司. Unit 3004, Two Exchange Square, 8 Connaught Place, Hong Kong, which is licensed by the Securities and Futures Commission (“SFC”) to conduct Type 1 regulated activities (CE: AQA779). Registered in Hong Kong under the Companies Ordinance (Chapter 622), No. 1173058.

In Canada: Pyrford relies upon the “International Adviser Exemption” in subsection 8.26 of National Instrument 31-103 Registration Requirements, Exemptions and Ongoing Registrant Obligations to advise “permitted clients” in Alberta, British Columbia, Manitoba, Ontario and Quebec.

In Australia: Issued by Threadneedle Investments Singapore (Pte.) Limited [“TIS”], ARBN 600 027 414. TIS is exempt from the requirement to hold an Australian financial services licence under the Corporations Act 2001 (Cth) and relies on Class Order 03/1102 in respect of the financial services it provides to wholesale clients in Australia. This document should only be distributed in Australia to ‘wholesale clients’ as defined in Section 761G of the Corporations Act. TIS is regulated in Singapore (Registration number: 201101559W) by the Monetary Authority of Singapore under the Securities and Futures Act (Chapter 289), which differ from Australian laws.

Pyrford International Ltd is a wholly owned subsidiary of Columbia Threadneedle Investments UK International Limited, whose direct parent is Ameriprise Financial Inc., a company incorporated in the United States.

Related Insights

6 July 2026

Anthony Willis

Senior Economist, Multi-Asset Solutions team

Market Perspectives: Playing for time

After an intense first half, financial markets appear to be entering a more measured phase.
29 June 2026

Anthony Willis

Senior Economist, Multi-Asset Solutions team

Market Perspectives: Postcard from Milan: What’s in store for H2?

As investors look ahead to the second half of 2026, the market backdrop appears somewhat less fraught than it did during the first six months of the year.
23 June 2026

Anthony Willis

Senior Economist, Multi-Asset Solutions team

Market Perspectives: Postcard from Switzerland: Should markets be moving more?

Despite a fluctuating geopolitical and policy backdrop, financial markets have remained relatively contained.
6 July 2026

Anthony Willis

Senior Economist, Multi-Asset Solutions team

Market Perspectives: Playing for time

After an intense first half, financial markets appear to be entering a more measured phase.
2 July 2026

Guillaume Langellier

Senior Credit Research Analyst

Should investment grade prime office landlords worry about AI?

AI is reinforcing prime office demand in the short term, but the bigger question is whether productivity gains will ultimately limit hiring and space needs.
30 June 2026

In Credit Weekly Snapshot – The tied is high

Events in the Middle East continue to influence economic policy, with central banks revisiting future rate moves as the oil price returns to pre-conflict levels.

Important information

For use by professional clients and/or equivalent investor types in your jurisdiction (not to be used with or passed on to retail clients).

This document is intended for informational purposes only and should not be considered representative of any particular investment. This should not be considered an offer or solicitation to buy or sell any securities or other financial instruments, or to provide investment advice or services. Investing involves risk including the risk of loss of principal. Your capital is at risk. Market risk may affect a single issuer, sector of the economy, industry or the market as a whole. The value of investments is not guaranteed, and therefore an investor may not get back the amount invested. International investing involves certain risks and volatility due to potential political, economic or currency fluctuations and different financial and accounting standards. The securities included herein are for illustrative purposes only, subject to change and should not be construed as a recommendation to buy or sell. Securities discussed may or may not prove profitable.

The views expressed are as of the date given, may change as market or other conditions change and may differ from views expressed by other Columbia Threadneedle Investments (Columbia Threadneedle) associates or affiliates. Actual investments or investment decisions made by Columbia Threadneedle and its affiliates, whether for its own account or on behalf of clients, may not necessarily reflect the views expressed. This information is not intended to provide investment advice and does not take into consideration individual investor circumstances. Investment decisions should always be made based on an investor’s specific financial needs, objectives, goals, time horizon and risk tolerance. Asset classes described may not be suitable for all investors. Past performance does not guarantee future results, and no forecast should be considered a guarantee either. Information and opinions provided by third parties have been obtained from sources believed to be reliable, but accuracy and completeness cannot be guaranteed. This document and its contents have not been reviewed by any regulatory authority.

In the UK: Issued by Pyrford International Limited, which is authorised and regulated by the Financial Conduct Authority.

In the EEA: Issued by Columbia Threadneedle Netherlands B.V., which is regulated by the Dutch Authority for the Financial Markets (AFM).

In Switzerland: Issued by Threadneedle Portfolio Services AG, Registered address: Claridenstrasse 41, 8002 Zurich, Switzerland.

In the Middle East: This document is distributed by Columbia Threadneedle Investments (ME) Limited, which is regulated by the Dubai Financial Services Authority (DFSA). For Institutional Clients: The information in this document is not intended as financial advice and is only intended for persons with appropriate investment knowledge and who meet the regulatory criteria to be classified as a Professional Client or Market Counterparties and no other Person should act upon it. This document and its contents and any other information or opinions subsequently supplied or given to you are strictly confidential and for your sole use only and not for further distribution. By accepting delivery of this presentation, you agree that it is not to be copied or reproduced in whole or in part and that you will not disclose its contents to any other person. For Distributors: This document is intended to provide distributors with information about Group products and services and is not for further distribution.

In the USA: Pyrford International Ltd, registered by the U.S. Securities and Exchange Commission as an Investment Adviser.

In Singapore: Issued by Threadneedle Investments Singapore (Pte.) Limited, 3 Killiney Road, #07-07, Winsland House 1, Singapore 239519, which is regulated in Singapore by the Monetary Authority of Singapore under the Securities and Futures Act (Chapter 289). Registration number: 201101559W. This advertisement has not been reviewed by the Monetary Authority of Singapore.

In Hong Kong: Issued by Threadneedle Portfolio Services Hong Kong Limited 天利投資管理香港有限公司. Unit 3004, Two Exchange Square, 8 Connaught Place, Hong Kong, which is licensed by the Securities and Futures Commission (“SFC”) to conduct Type 1 regulated activities (CE: AQA779). Registered in Hong Kong under the Companies Ordinance (Chapter 622), No. 1173058.

In Canada: Pyrford relies upon the “International Adviser Exemption” in subsection 8.26 of National Instrument 31-103 Registration Requirements, Exemptions and Ongoing Registrant Obligations to advise “permitted clients” in Alberta, British Columbia, Manitoba, Ontario and Quebec.

In Australia: Issued by Threadneedle Investments Singapore (Pte.) Limited [“TIS”], ARBN 600 027 414. TIS is exempt from the requirement to hold an Australian financial services licence under the Corporations Act 2001 (Cth) and relies on Class Order 03/1102 in respect of the financial services it provides to wholesale clients in Australia. This document should only be distributed in Australia to ‘wholesale clients’ as defined in Section 761G of the Corporations Act. TIS is regulated in Singapore (Registration number: 201101559W) by the Monetary Authority of Singapore under the Securities and Futures Act (Chapter 289), which differ from Australian laws.

Pyrford International Ltd is a wholly owned subsidiary of Columbia Threadneedle Investments UK International Limited, whose direct parent is Ameriprise Financial Inc., a company incorporated in the United States.

Icon checked

Thank you. You can now visit your preference centre​ to choose which insights you would like to receive by email.