
fi
FI
Finland
en-FI
fi_intm_classes
intm
Intermediary
en
en
For use by professional clients and/or equivalent investor types in your jurisdiction (not to be used with or passed on to retail clients).
Panoramic nighttime view of Tokyo’s illuminated skyline, with Tokyo Tower prominently lit in orange in the center.

Insights

Too Big to Bundle: Why Japan merits a dedicated equity allocation

At a glance

  • The investment case for Japan rests on corporate governance reforms, not monetary policy, currency movements or economic activity.
  • As companies unwind corporate cross-shareholdings, we see opportunities for ample value creation for investors.
  • Lower correlations with other international stock markets, and limited analyst coverage makes Japan an attractive portfolio diversifier and a market where active management can thrive.

For decades, corporate Japan was defined by stagnation—low growth, entrenched management teams and idle capital on balance sheets. Today, that landscape looks markedly different. Corporate reform, rising merger and acquisition (M&A) activity, reflationary dynamics and a steady shift of household assets from savings into investment are reshaping both corporate behaviour and market opportunities.

Yet investor allocations have been slower to adjust. Many portfolios still access Japan incidentally, as part of a broad international mandate, rather than through a dedicated allocation, often limiting the ability of specialist active managers to fully exploit the breadth of opportunities emerging from these structural changes. In our view, this overlooks one of the most significant corporate transformations underway in global equity markets, and a valuable opportunity to strengthen portfolio diversification.

Why the Japan opportunity has changed

The investment case for Japan today is fundamentally different from previous cycles. Historically, many investors focused on monetary policy, currency movements or economic growth. Today, boardroom changes are the more important story.

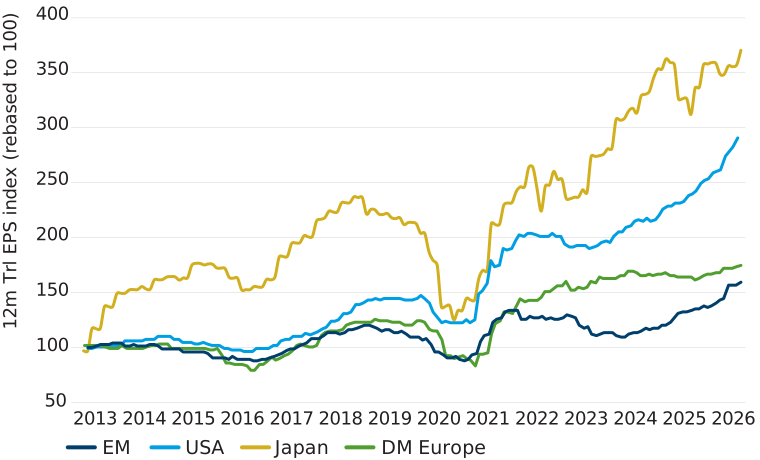
Since the launch of Abenomics, Japanese companies have delivered stronger cumulative earnings-per-share growth than their U.S. counterparts despite Japan’s relatively modest economic growth. This earnings strength reflects structural improvements in profitability, capital allocation and management discipline rather than favourable macroeconomic conditions alone.

Japanese corporate earnings growth outpaced U.S. peers throughout the Abenomics era
Graph

Source: Jefferies. August 31, 2026. MSCI indices used across all regions.

Corporate governance reform is at the heart of this change. The Tokyo Stock Exchange’s (TSE’s) focus on capital efficiency, combined with increasing shareholder engagement, is encouraging companies to improve returns on equity, simplify corporate structures and allocate capital more effectively. As a result, dividend growth and share buybacks have reached record levels, while companies are becoming more willing to divest non-core assets, restructure businesses and pursue strategic M&A.

Importantly, this reform story is far from complete. Despite meaningful progress, Japanese corporates continue to hold cash balances exceeding 40% of gross domestic product (GDP), more than double U.S. levels.

One of the clearest manifestations of Japan’s corporate governance reforms has been the accelerating unwinding of cross-shareholdings. For decades, Japanese companies accumulated large portfolios of shares in other companies, often generating profits without meaningfully returning capital to shareholders. Today, the TSE requires listed companies to justify these holdings based on both strategic relevance and economic returns, with companies unable to do so increasingly coming under pressure to explain why these assets remain on the balance sheet.

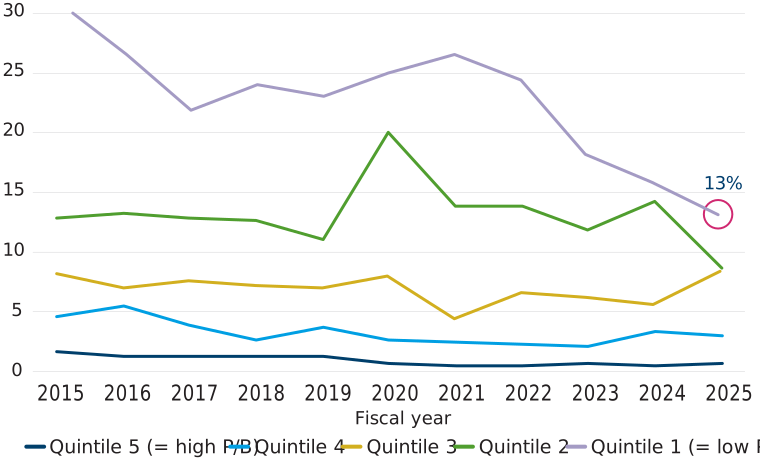
As scrutiny of capital efficiency intensifies, particularly among companies trading below book value, the pace of cross-shareholding disposals has accelerated. The opportunity remains substantial. Investment securities still represent around 13% of market capitalisation for the cheapest valuation quintile of Japanese equities, compared with just 0.5% for the most expensive. These lower-valued companies are also the most active sellers, with 77% reporting securities disposals in the most recent fiscal year and generating cash proceeds equivalent to 1.6% of aggregate market capitalisation. Proceeds from these disposals are typically reallocated across a combination of internal reinvestment, inorganic growth initiatives and the return of excess capital to shareholders.

Yet despite accelerating disposals, the cross-shareholding unwind could take another decade to complete at the current pace. Strategic shareholdings across the TOPIX still total approximately ¥53 trillion, or around 7% of market capitalisation. As excess cross-shareholdings are monetised and capital allocation becomes more disciplined, a significant portion of the potential shareholder value creation opportunity still lies ahead.

Hidden asset value persists in Japan’s lowest-valued companies

Shareholdings as a % of market capitalisation
graph

Source: JP Morgan.  August 31, 2026. Strategic shareholdings as a percentage of market capitalisation. Aggregate data for TOPIX 500 companies with available data measured at the beginning of fiscal year.

The scale of these excess balance-sheet resources helps explain why engagement-led value creation remains such a powerful theme today. Japan is now one of the world’s most active markets for shareholder engagement, private equity investment and M&A activity—with investors increasingly encouraging companies to unlock value through improved governance, portfolio rationalisation and more disciplined capital allocation. The sharp increase in M&A activity and transactions such as the proposed Toyota Industries buyout demonstrate that even long-established corporate structures are no longer immune to change.

Is Japan following America's value creation playbook?

What is unfolding in Japan today bears striking similarities to the U.S. in the early 1980s, a period that preceded one of the greatest wealth creation cycles in modern history. At that time, nearly 40% of U.S. equities traded below book value, corporate returns on equity languished in the mid-single digits and capital was trapped within sprawling conglomerates that faced mounting pressure to improve efficiency and shareholder returns. The response was a profound shift in corporate behaviour, driven by deregulation, restructuring, M&A activity and a renewed focus on capital discipline, laying the foundation for decades of value creation. What is unfolding in Japan today bears striking similarities to the U.S. in the early 1980s, a period that preceded one of the greatest wealth creation cycles in modern history. At that time, nearly 40% of U.S. equities traded below book value, corporate returns on equity languished in the mid-single digits and capital was trapped within sprawling conglomerates that faced mounting pressure to improve efficiency and shareholder returns. The response was a profound shift in corporate behaviour, driven by deregulation, restructuring, M&A activity and a renewed focus on capital discipline, laying the foundation for decades of value creation.

Japan is now undergoing a similar transformation. Governance reforms are encouraging companies to improve profitability, optimise balance sheets and prioritise shareholder returns, while a highly fragmented corporate landscape still offers significant scope for consolidation.

Japan’s valuation opportunity resembles the U.S. market of the 1980s
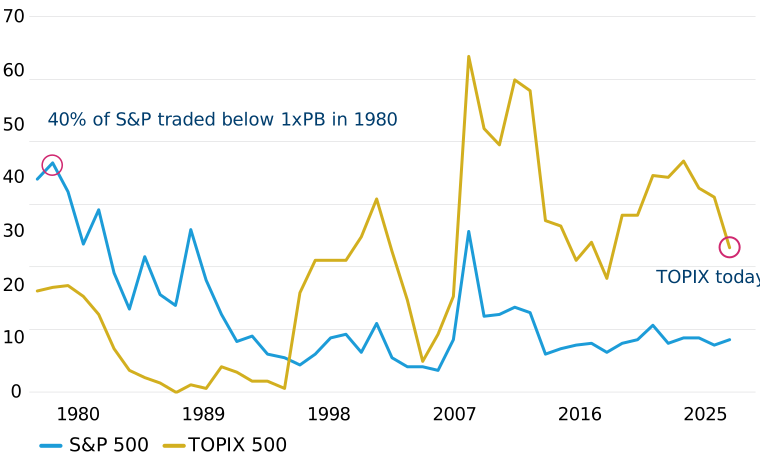
Source: Bloomberg and Sumitomo Mitsui Banking Corp. (SMBC). December 2025. Chart shows the ratio of stocks with PBR (price-to-book ratio) below 1 within the Japan-U.S. universe. Calculated monthly since January 1980.

Japan also remains in the early stages of a retail investor revolution. Just as the introduction of 401(k)s and IRAs in the U.S. channelled household savings into equities, Japan’s expanded Nippon Individual Savings Account (NISA) programme is encouraging a generation of first-time investors to shift assets out of cash and into the stock market. Japanese households hold approximately $15 trillion of financial assets, a sum equivalent to more than four times France’s GDP, yet around half of this wealth remains in cash and deposits. The U.S. experience illustrates how household portfolios can evolve as savings gradually move towards investment, highlighting the potential scale of Japan’s long-term asset-reallocation opportunity.

Japan’s equity ownership gap points to further market upside
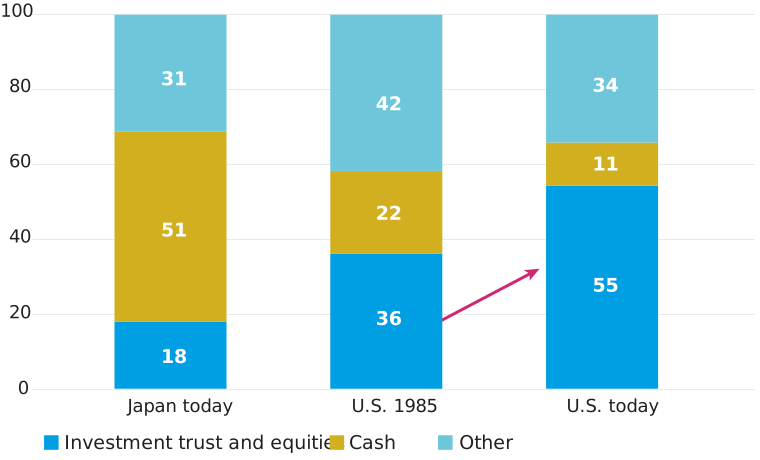
Source: Morgan Stanley MUFG Research. December 2025. Chart shows total breakdown of household assets by percentage.

Japan's role in international portfolios

While a country allocation may appear to increase concentration risk, portfolio risk is ultimately determined by how assets interact within the broader portfolio. Japanese equities have historically demonstrated low correlation with U.S. equities, especially technology-driven benchmarks. While some correlations exist, it remains materially lower than that of most major developed equity markets. The lower correlation is most pronounced in hedged Japanese equities and Japan small-and mid- (SMID) caps, suggesting that both currency and exposure beyond large caps can influence the role Japan plays in portfolio construction.

Japanese stocks behave differently

Correlation Matrix: Returns – Five years
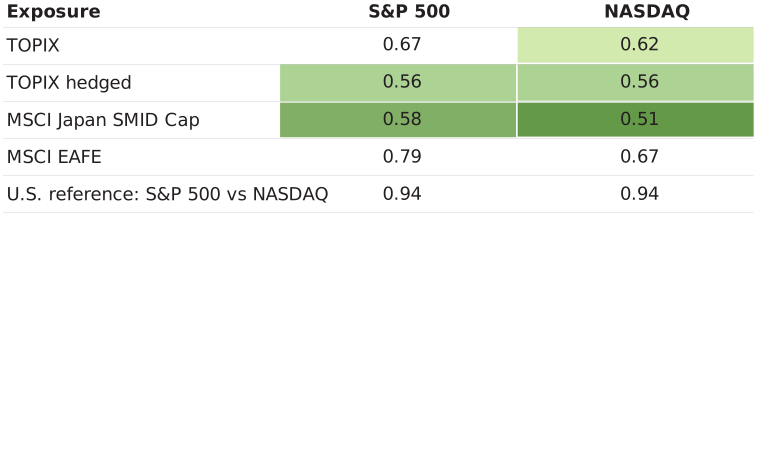
Source: FactSet, June 2026.

The structure of the market itself supports this differentiated behaviour. Japan provides exposure to a market with a distinct structure and sector composition. The ten largest S&P 500 companies account for roughly 38% of index capitalisation, near an all-time high. In Japan the top ten are closer to 23%. Sector exposures also differ meaningfully, with the Japanese market providing greater representation in financials, industrials and automobiles.

Japan’s sector composition may enhance portfolio diversification
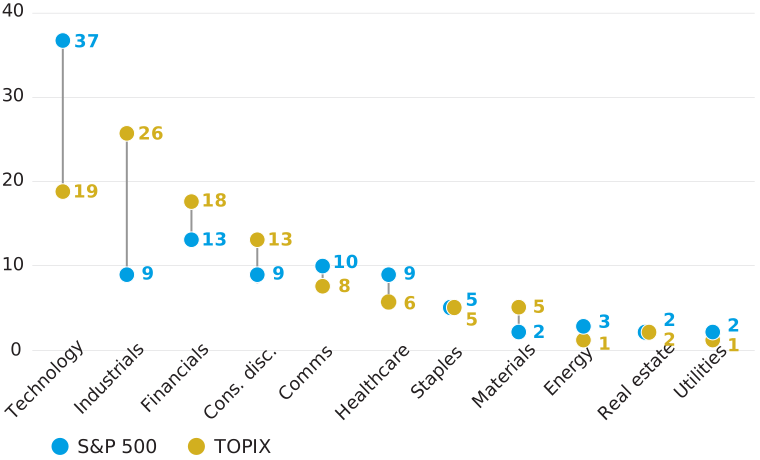
Source: FactSet. GICS Sector Weights: S&P 500 vs. Japan. August 2026.

Importantly, investors are not required to pay a premium for these diversification benefits. Japanese equities trade at a meaningful discount to the U.S. on forward earnings, by most measures 15% to 20%. The diversification does not come at a premium.

The case for specialist active management

Returns in Japan are increasingly a function of stock selection, not market exposure. Japan is also one of the least efficiently researched developed markets in the world, with ~45% of the TOPIX not covered by any sell-side analyst.

Nearly half of TOPIX companies lack sell-side coverage
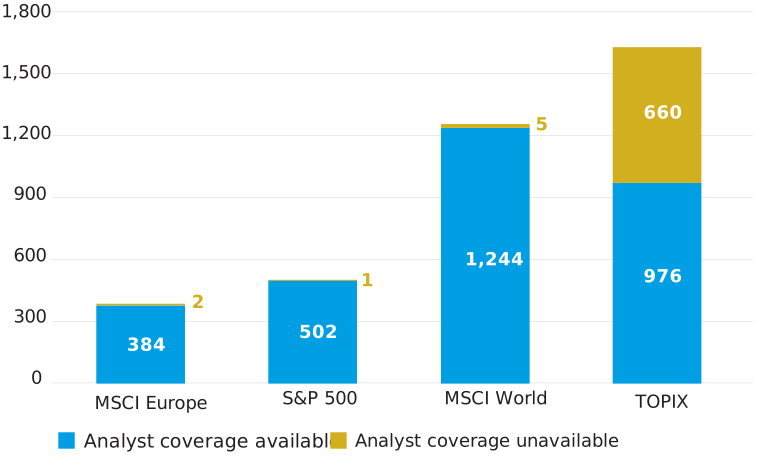
Source: Bloomberg. October 2026.

Combined with wide dispersion in profitability, governance standards and capital allocation practices, this lack of coverage creates fertile conditions for skilled active managers to add value through stock selection. Evidence can be seen in the historical record, with the median Japan equity manager outperforming its benchmark across most trailing periods over the past decade.

Japan's market structure favours active management
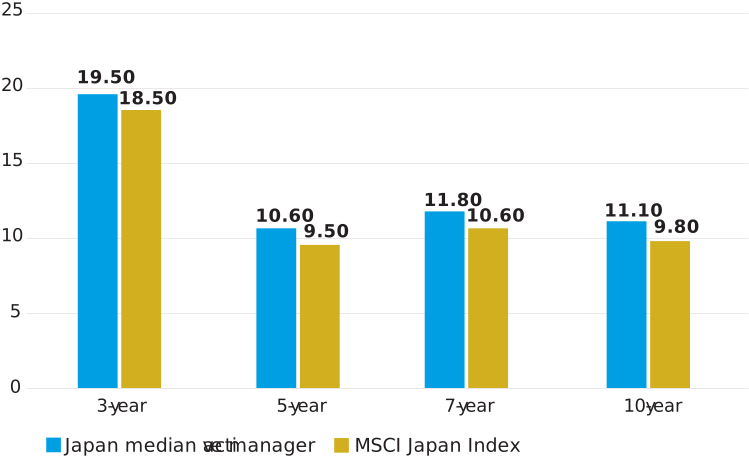
Source: Factset. eVestment Japan Large cap equity. Data as of June 30, 2026.

However, manager selection is equally important. Successfully navigating this market requires a specialist team with deep experience and a repeatable investment process. We believe a quality-focused approach is particularly well positioned for Japan’s low-growth environment. By investing across both growth and value opportunities, investors can gain exposure to companies capable of delivering sustainable earnings growth, improving capital efficiency and long-term value creation.

The bottom line

The evolution of corporate Japan has outpaced investor allocations. Governance reform is driving capital discipline and higher shareholder returns. Earnings have compounded faster than in the U.S., built on structural change rather than macro tailwinds. The market offers diversification benefits through differentiated sector composition and correlation profile. And beneath all of it, inefficiency plays to the strengths of active management in a way passive exposure can’t replicate.

None of this stands out in a broad international sleeve. Diluted across a non-U.S. developed market or All Country World allocation, Japan becomes a rounding error – its correlation benefits, its distinct sector mix, its earnings trajectory are all averaged away rather than captured. Realising this opportunity means sizing Japan on its own terms and pairing it with the specialist, active management the market specifically rewards.

The reform is real, it’s unfinished and it’s investable. The question for allocators isn’t whether Japan belongs in a portfolio – it’s whether it belongs by design, or merely by accident.


Key topics

Subscribe to insights

Get the most out of your email by tailoring the types of insights and information you would like to receive from us.

Latest articles

We explain how we’ve navigated recent market moves across emerging markets and why we see opportunities broadening across countries, sectors and companies.
A repeatable, rules-based investment process can help active ETFs navigate concentrated markets, capture opportunities created by stock-level dispersion and offer investors a more purposeful approach to core equity exposure.
For decades, corporate Japan was defined by stagnation—low growth, entrenched management teams and idle capital on balance sheets. Today, that landscape looks markedly different.
Key topics
Related topics

Important information

For use by professional clients and/or equivalent investor types in your jurisdiction (not to be used with or passed on to retail clients). For marketing purposes.

This document is intended for informational purposes only and should not be considered representative of any particular investment. This should not be considered an offer or solicitation to buy or sell any securities or other financial instruments, or to provide investment advice or services. Investing involves risk including the risk of loss of principal. Your capital is at risk. Market risk may affect a single issuer, sector of the economy, industry or the market as a whole. The value of investments is not guaranteed, and therefore an investor may not get back the amount invested. International investing involves certain risks and volatility due to potential political, economic or currency fluctuations and different financial and accounting standards. The securities included herein are for illustrative purposes only, subject to change and should not be construed as a recommendation to buy or sell. Securities discussed may or may not prove profitable. The views expressed are as of the date given, may change as market or other conditions change and may differ from views expressed by other Columbia Threadneedle Investments (Columbia Threadneedle) associates or affiliates. Actual investments or investment decisions made by Columbia Threadneedle and its affiliates, whether for its own account or on behalf of clients, may not necessarily reflect the views expressed. This information is not intended to provide investment advice and does not take into consideration individual investor circumstances. Investment decisions should always be made based on an investor’s specific financial needs, objectives, goals, time horizon and risk tolerance. Asset classes described may not be suitable for all investors. Past performance does not guarantee future results, and no forecast should be considered a guarantee either. Information and opinions provided by third parties have been obtained from sources believed to be reliable, but accuracy and completeness cannot be guaranteed. This document and its contents have not been reviewed by any regulatory authority.

In Australia: Issued by Threadneedle Investments Singapore (Pte.) Limited [“TIS”], ARBN 600 027 414. TIS is exempt from the requirement to hold an Australian financial services licence under the Corporations Act 2001 (Cth) and relies on Class Order 03/1102 in respect of the financial services it provides to wholesale clients in Australia. This document should only be distributed in Australia to “wholesale clients” as defined in Section 761G of the Corporations Act. TIS is regulated in Singapore (Registration number: 201101559W) by the Monetary Authority of Singapore under the Securities and Futures Act (Chapter 289), which differ from Australian laws.

In Singapore: Issued by Threadneedle Investments Singapore (Pte.) Limited, 3 Killiney Road, #07-07, Winsland House 1, Singapore 239519, which is regulated in Singapore by the Monetary Authority of Singapore under the Securities and Futures Act (Chapter 289). Registration number: 201101559W. This advertisement has not been reviewed by the Monetary Authority of Singapore.

In Hong Kong: Issued by Threadneedle Portfolio Services Hong Kong Limited 天利投資管理香港有限公司. Unit 3004, Two Exchange Square, 8 Connaught Place, Hong Kong, which is licensed by the Securities and Futures Commission (“SFC”) to conduct Type 1 regulated activities (CE:AQA779). Registered in Hong Kong under the Companies Ordinance (Chapter 622), No. 1173058.

In Japan: Issued by Columbia Threadneedle Investments Japan Co., Ltd. Financial Instruments Business Operator, The Director-General of Kanto Local Finance Bureau (FIBO) No.3281, and a member of Investment Management Association of Japan and Type II Financial Instruments Firms Association.

In the UK: Issued by Threadneedle Asset Management Limited, No. 573204 and/or Columbia Threadneedle Management Limited, No. 517895, both registered in England and Wales and authorised and regulated in the UK by the Financial Conduct Authority.

In the EEA: Issued by Threadneedle Management Luxembourg S.A., registered with the Registre de Commerce et des Sociétés (Luxembourg), No. B 110242 and/or Columbia Threadneedle Netherlands B.V., regulated by the Dutch Authority for the Financial Markets (AFM), registered No. 08068841.

In Switzerland: Issued by Threadneedle Portfolio Services AG, Registered address: Claridenstrasse 41, 8002 Zurich, Switzerland.

In the Middle East: This document is distributed by Columbia Threadneedle Investments (ME) Limited, which is regulated by the Dubai Financial Services Authority (DFSA). For Distributors: This document is intended to provide distributors with information about Group products and services and is not for further distribution. For Institutional Clients: The information in this document is not intended as financial advice and is only intended for persons with appropriate investment knowledge and who meet the regulatory criteria to be classified as a Professional Client or Market Counterparties and no other Person should act upon it.

This document may be made available to you by an affiliated company which is part of the Columbia Threadneedle Investments group of companies: Columbia Threadneedle Management Limited in the UK; Columbia Threadneedle Netherlands B.V., regulated by the Dutch Authority for the Financial Markets (AFM), registered No. 08068841.

Columbia Threadneedle Investments is the global brand name of the Columbia and Threadneedle group of companies. © 2026 Columbia Threadneedle. All rights reserved.

Related Insights

27 October 2026

In Credit Weekly Snapshot – Copacabana

His name is Lula, and a surprising election victory in Brazil saw spreads widen in local markets. Elsewhere, yield curves flattened in the US, Japan and Germany.
20 October 2026

In Credit Weekly Snapshot – One night in Bangkok

Geopolitics remain a key market concern, despite being hard to measure, with tensions feeding through to oil prices, inflation concerns and bond markets.
20 October 2026

Head of Investment Grade Research, EMEA

AI bond supply: Why the market can absorb the coming wave

Strong demand, robust issuer fundamentals and clearer communication should help the market absorb the expected surge in artificial intelligence-related bond issuance.
29 October 2026

Client Portfolio Manager, Emerging Market Equities

Emerging Markets: A broadening opportunity

We explain how we’ve navigated recent market moves across emerging markets and why we see opportunities broadening across countries, sectors and companies.
29 October 2026

Head of EMEA Active ETF Distribution

Rethinking the core: why active ETFs can play a bigger role in today’s equity portfolios

A repeatable, rules-based investment process can help active ETFs navigate concentrated markets, capture opportunities created by stock-level dispersion and offer investors a more purposeful approach to core equity exposure.
28 October 2026

Portfolio Manager, UK Equities

The UK: The path from squeeze to spending

We look at how the UK domestic economic cycle operates and why the UK consumer recovery could be closer than you think.

Important information

For use by professional clients and/or equivalent investor types in your jurisdiction (not to be used with or passed on to retail clients). For marketing purposes.

This document is intended for informational purposes only and should not be considered representative of any particular investment. This should not be considered an offer or solicitation to buy or sell any securities or other financial instruments, or to provide investment advice or services. Investing involves risk including the risk of loss of principal. Your capital is at risk. Market risk may affect a single issuer, sector of the economy, industry or the market as a whole. The value of investments is not guaranteed, and therefore an investor may not get back the amount invested. International investing involves certain risks and volatility due to potential political, economic or currency fluctuations and different financial and accounting standards. The securities included herein are for illustrative purposes only, subject to change and should not be construed as a recommendation to buy or sell. Securities discussed may or may not prove profitable. The views expressed are as of the date given, may change as market or other conditions change and may differ from views expressed by other Columbia Threadneedle Investments (Columbia Threadneedle) associates or affiliates. Actual investments or investment decisions made by Columbia Threadneedle and its affiliates, whether for its own account or on behalf of clients, may not necessarily reflect the views expressed. This information is not intended to provide investment advice and does not take into consideration individual investor circumstances. Investment decisions should always be made based on an investor’s specific financial needs, objectives, goals, time horizon and risk tolerance. Asset classes described may not be suitable for all investors. Past performance does not guarantee future results, and no forecast should be considered a guarantee either. Information and opinions provided by third parties have been obtained from sources believed to be reliable, but accuracy and completeness cannot be guaranteed. This document and its contents have not been reviewed by any regulatory authority.

In Australia: Issued by Threadneedle Investments Singapore (Pte.) Limited [“TIS”], ARBN 600 027 414. TIS is exempt from the requirement to hold an Australian financial services licence under the Corporations Act 2001 (Cth) and relies on Class Order 03/1102 in respect of the financial services it provides to wholesale clients in Australia. This document should only be distributed in Australia to “wholesale clients” as defined in Section 761G of the Corporations Act. TIS is regulated in Singapore (Registration number: 201101559W) by the Monetary Authority of Singapore under the Securities and Futures Act (Chapter 289), which differ from Australian laws.

In Singapore: Issued by Threadneedle Investments Singapore (Pte.) Limited, 3 Killiney Road, #07-07, Winsland House 1, Singapore 239519, which is regulated in Singapore by the Monetary Authority of Singapore under the Securities and Futures Act (Chapter 289). Registration number: 201101559W. This advertisement has not been reviewed by the Monetary Authority of Singapore.

In Hong Kong: Issued by Threadneedle Portfolio Services Hong Kong Limited 天利投資管理香港有限公司. Unit 3004, Two Exchange Square, 8 Connaught Place, Hong Kong, which is licensed by the Securities and Futures Commission (“SFC”) to conduct Type 1 regulated activities (CE:AQA779). Registered in Hong Kong under the Companies Ordinance (Chapter 622), No. 1173058.

In Japan: Issued by Columbia Threadneedle Investments Japan Co., Ltd. Financial Instruments Business Operator, The Director-General of Kanto Local Finance Bureau (FIBO) No.3281, and a member of Investment Management Association of Japan and Type II Financial Instruments Firms Association.

In the UK: Issued by Threadneedle Asset Management Limited, No. 573204 and/or Columbia Threadneedle Management Limited, No. 517895, both registered in England and Wales and authorised and regulated in the UK by the Financial Conduct Authority.

In the EEA: Issued by Threadneedle Management Luxembourg S.A., registered with the Registre de Commerce et des Sociétés (Luxembourg), No. B 110242 and/or Columbia Threadneedle Netherlands B.V., regulated by the Dutch Authority for the Financial Markets (AFM), registered No. 08068841.

In Switzerland: Issued by Threadneedle Portfolio Services AG, Registered address: Claridenstrasse 41, 8002 Zurich, Switzerland.

In the Middle East: This document is distributed by Columbia Threadneedle Investments (ME) Limited, which is regulated by the Dubai Financial Services Authority (DFSA). For Distributors: This document is intended to provide distributors with information about Group products and services and is not for further distribution. For Institutional Clients: The information in this document is not intended as financial advice and is only intended for persons with appropriate investment knowledge and who meet the regulatory criteria to be classified as a Professional Client or Market Counterparties and no other Person should act upon it.

This document may be made available to you by an affiliated company which is part of the Columbia Threadneedle Investments group of companies: Columbia Threadneedle Management Limited in the UK; Columbia Threadneedle Netherlands B.V., regulated by the Dutch Authority for the Financial Markets (AFM), registered No. 08068841.

Columbia Threadneedle Investments is the global brand name of the Columbia and Threadneedle group of companies. © 2026 Columbia Threadneedle. All rights reserved.

Icon checked

Thank you. You can now visit your preference centre​ to choose which insights you would like to receive by email.

Icon checked

Thank you. You can now visit your preference centre​ to choose which insights you would like to receive by email.