

be
BE
Belgium
en-BE
be_inst_classes
inst
Institutional
en
en
For use by professional clients and/or equivalent investor types in your jurisdiction (not to be used with or passed on to retail clients).
View of busy London street at sunrise

Insights

The UK: The path from squeeze to spending

Dominic Younger
Dominic Younger
Portfolio Manager, UK Equities

We look at how the UK domestic economic cycle operates and why the UK consumer recovery could be closer than you think.

Pick up a UK newspaper and the country’s economic news looks, at best, uninspiring. Wage growth has slowed year-on-year.1 Hiring has softened with vacancies falling to their lowest level since early 2021.2 Consumer confidence, as measured by GfK’s monthly survey, sat at -24 in October 2026, the lowest since the aftermath of the start of the US-Iran conflict in April.3 For many investors, this feels like a reason to stay away from UK-focused companies.

But there is a counterintuitive truth that experienced investors have learned from watching several UK economic cycles: the moment things look most disappointing is often precisely when the most interesting investment opportunities begin to form. As Sir John Templeton is widely quoted as saying ‘the time of maximum pessimism is the best time to buy, and the time of maximum optimism is the best time to sell.’

A crucial distinction: nominal versus real

First, it helps to understand an important economic concept: the difference between nominal and real income.

Your nominal wage is the number on your payslip. Your real wage is what that number actually buys after accounting for inflation. It is the real figure that determines whether your household is getting richer or poorer.

For example, if your pay rises by 4% this year, that sounds decent. But if prices in the shops are rising by 5%, you are actually worse off. Your pay packet buys less than it did 12 months ago. Now flip it around: if your pay rises by 3.5% but inflation is only 2%, you are actually better off in real terms, even though the nominal pay rise is smaller.

This distinction is at the heart of the UK story right now.

What has happened to UK households since 2022?

Between 2022 and 2023 UK households were caught in a painful vice. Energy bills surged following the war in Ukraine. Food prices rose sharply. Mortgage rates climbed from near-zero to levels not seen in more than a decade. Taxes increased. Even though wages were rising in nominal terms, at times by 7% or more, inflation was rising faster. In real terms, households were getting poorer.

Figure 1 tells this story clearly. Real wage growth (light blue) was sharply negative in 2022 as inflation (gold) overwhelmed nominal pay rises (dark blue). The good news is that this light blue line has now turned positive again. In the three months to August, regular pay grew by 3.7% year on year4, compared with the Consumer Prices Index including owner occupiers’ housing costs (CPIH) inflation of 3.3%.5 The fact that real wages remain positive matters, although the recent narrowing of the gap highlights certain risks to recovery.

Figure 1: The real UK income story
UK wages versus inflation 2022-2026
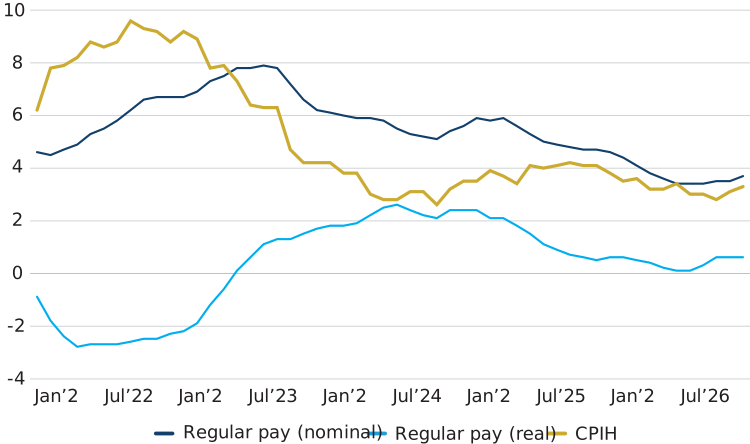
Figure 1: The real UK income story. UK wages versus inflation 2022-2026

Source: Source: Office for National Statistics, average weekly earnings annual growth rates in Great Britain, seasonally adjusted, January-March 2022 to June-August 2026, monthly rolling three-month figures, CPIH to August 2026, monthly rolling 12-month figures.

The five stages of a consumer recovery

Understanding how a consumer recovery unfolds is essential for investors. It does not happen overnight, nor in the way most people expect. There is a clear sequence, each stage setting the conditions for the next.

  • STAGE 1: The soft patch. This is where the UK arguably sits today. Wage growth is moderating from post-pandemic highs. Hiring has slowed. Vacancies remain subdued. GDP growth is underwhelming. At first glance this feels negative. But a cooling labour market and easing wage pressures are important ingredients in bringing inflationary pressures under control. Crucially, wages are not falling: regular pay is still growing slightly faster than inflation, supporting real household incomes even as wage pressures moderate. That creates an important foundation for recovery.
  • STAGE 2: Real income recovery. If inflation resumes its decline towards the 2% Bank of England (BoE) target, something quietly powerful happens: even with more modest pay rises, households start to feel better off. Food bills stop rising as fast. Energy costs normalise. The base interest rate, which the BoE began cutting in late 2024 and brought to 3.75% by December 2025, has gradually eased borrowing costs, although renewed monetary tightening in November may temporarily limit further relief.6 Once the cutting cycle resumes, households squeezed by higher costs in 2023 should gradually find themselves with a little more money left at the end of each month.
  • STAGE 3: Lower rates improve cash flow. The UK is particularly sensitive to rate changes. Unlike in the United States, where many homeowners lock in mortgage rates for 30 years, most UK mortgages are fixed for only two to five years. This means that when rates fall, the benefit reaches households relatively quickly as mortgages come up for renewal, although some households refinancing older fixed-rate deals may still face higher payments. Consumers do not need rates to return to zero. They simply need confidence that the next move is down rather than up. That psychological shift can be surprisingly powerful.
  • STAGE 4: Confidence rebuilds. This is the bridge that connects improving finances to actual spending. Consumer psychology tends to move through three distinct stages: fear (“I might lose my job”), stability (“I’ll probably keep my job”), and optimism (“I might get a pay rise and my mortgage payments will fall”). Releveraging, the willingness to borrow and spend again, begins in this Stage 4 optimism phase. Not because money is cheap, but because households feel secure enough to take on financial commitments again.
  • STAGE 5: Credit growth returns. Historically, credit growth lags rate cuts by a meaningful period: rates fall, confidence rises, then borrowing rises. Households first need to see inflation under control, jobs still available and real wages growing. Only then do they move house, renovate kitchens, buy cars, book holidays and spend more broadly. Credit begins expanding again and when it does, the companies that serve those consumers can see their earnings grow rapidly.

Why the housing market is the key transmission mechanism

The UK housing market plays a uniquely important role in the consumer cycle. When people move house, they spend money on kitchens, furniture, carpets, removals, surveys, solicitors and DIY. A single house move can trigger thousands of pounds of additional expenditure across a range of businesses.

The critical variable is not house prices but transaction volumes. When the number of people actually moving is low, as it has been in recent years, all of that associated spending is suppressed. When transactions recover it can create a surprisingly broad economic tailwind. We would expect to benefit from this tide of activity in our portfolios, whether it’s your cement from aggregates specialist Breedon, your timber from builders’ merchant Travis Perkins, or your new towels from M&S.

HMRC data showed around 95,000 seasonally adjusted residential transactions in August 2026, 2% lower than a year earlier and 1% below July, suggesting housing market activity remains relatively subdued.7 This reflects completions from offers generally made two to four months earlier. With the UK housing market representing three times the size of the domestic equity market, it remains a key potential source of renewed animal spirits in the economy. As mortgage affordability improves, supportive government measures emerge and confidence gradually rebuilds, housing activity is expected to strengthen through 2027.

The timeline: longer than investors hope, shorter than economists fear

One of the most important things to understand about economic recoveries is that the various stages do not happen simultaneously. There are three separate lags at work: first, the labour market and inflation cool; then rate cuts feed into household cash flows; and finally improved cash flows feed into confidence and borrowing. Each of these takes time.

Based on historical UK cycles, including the recovery from the 1992 European Exchange Rate Mechanism (ERM) crisis and the aftermath of the 2008-09 global financial crisis (GFC), it typically takes 12-24 months from the start of an easing cycle for the average household to feel materially better off, and 18-36 months before genuine credit-fuelled expansion becomes clearly visible in the data. Domestic equities typically begin rerating as central banks cut rates and mortgage affordability improves, well before the final stages are confirmed by economic data.

Applying this framework to today, a plausible roadmap could look as follows:

Period
What to expect
2026
Soft labour market. Inflation remains above target and may rise near term prompting renewed monetary tightening; softer demand and wage growth limit second-round effects.
Early 2027
Real income improvement becomes visible. Rates could move gradually lower if inflationary pressures subside and mortgage refinancing headwind fades. Housing activity and consumer confidence could begin to improve.
2027/2028
More obvious re-leveraging. Stronger credit growth. Better domestic demand. Domestic earnings accelerate.

What history tells us

The current situation has clear parallels with two previous UK cycles. Following the ERM crisis interest rates were cut aggressively, but consumers did not immediately start borrowing again. Instead, they spent roughly two years repairing their balance sheets and rebuilding confidence. It was only when unemployment began falling and job security improved that housing activity recovered and consumer credit accelerated. Domestic equities anticipated this well in advance.

Following the GFC, a similar pattern played out over a longer timeframe. The BoE cut rates to 0.5% by March 2009, but genuine consumer re-leveraging was not clearly visible until 2013-14. Yet equity markets had already moved significantly by then, rewarding those who had the conviction to invest when the economic data was still deeply discouraging.

The current post-inflation shock cycle, which began in 2022, appears to be following a similar path. The key difference this time is that unemployment has remained relatively low throughout, which means the confidence destruction has been less severe than in 1992 or 2009. That could mean the recovery, when it comes, arrives somewhat faster.

Investment lens

For investors seeking to benefit from this course of events, the impulse may be to wait and see. A look through historic analogues shows this can be a costly mistake however, with markets likely to ‘buy the rumour and sell the news’ as the old investor adage goes. In other words, by the time the data is unambiguous, the best of the returns have already been made.

Many UK domestic companies are currently priced as though the UK consumer will remain permanently weak. Yet their earnings are highly sensitive to exactly the kind of recovery described above. The sectors most likely to benefit from a resurgent consumer are set out here:

Figure 2 illustrates this dynamic from the 2007-2013 period. The dark blue line, representing the P/E rating on the more domestically oriented FTSE 250 index, begins rising well before the fundamentals, like mortgage approvals (red bars) or earnings (light blue). Stock markets are forward-looking mechanisms. They do not wait for the recovery to be confirmed; they price in the expectation of recovery.

Figure 2: Buy the rumour, sell the news?

FTSE 250: PE ratio vs EPS expectations
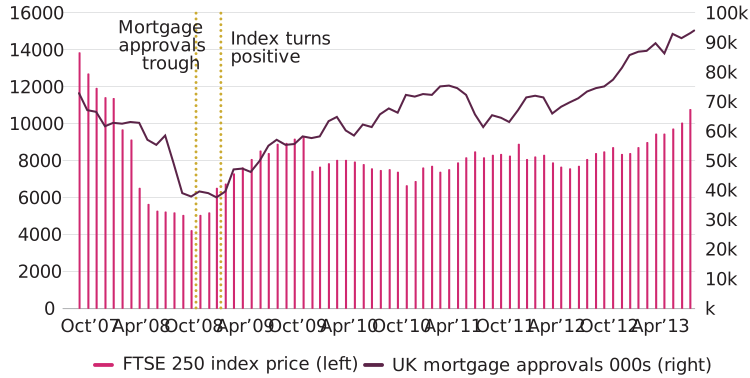
Figure 2: Buy the rumour, sell the news? FTSE 250: PE ratio vs EPS expectations

FTSE 250 index vs UK mortgage approvals
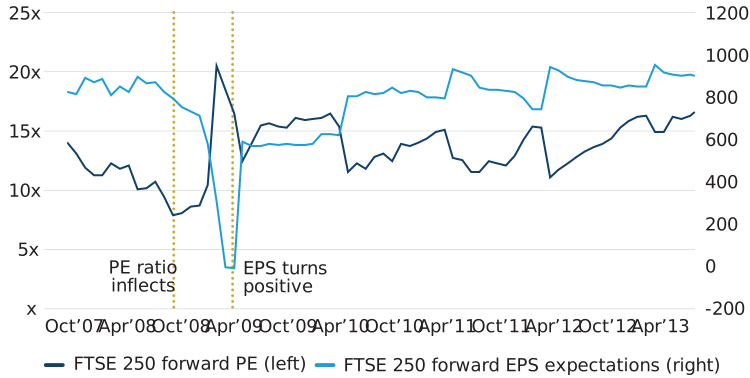
Figure 2: Buy the rumour, sell the news? FTSE 250 index vs UK mortgage approvals

Source: Columbia Threadneedle analysis based on data from the ONS, Bank of England, and HMRC. For illustrative purposes only, 2026. EPS = earnings per share. PE = price/earnings.

In both the 1992 and 2009 cycles, domestic UK equities began rerating significantly before households had resumed borrowing in earnest. The strongest period for UK domestic stocks is often precisely when the economy still looks mediocre, but when investors can see that real incomes, interest rates and financial conditions are all moving in the right direction.

Which companies stand to benefit?

Many UK domestic companies are currently priced as though the UK consumer will remain permanently weak. Yet their earnings are highly sensitive to exactly the kind of recovery described above. The sectors most likely to benefit from a resurgent consumer are set out here:

Sector
Why it benefits
Housebuilding and construction
Housebuilder business models are most exposed to house prices, while earnings at construction materials players tend to be more directly linked to volumes.
Retailers
Spending increases as confidence recovers. Largest inflection for those serving home improvement and discretionary spending; ‘big ticket’ items benefit from the housing transaction effect.
Travel & leisure
Discretionary spending on holidays and experiences recovers as household budgets improve and less money is set aside for a ‘rainy day’.
Banks
Both consumer and corporate lending volumes pick up as credit demand improves, although the effect of lower rates on interest income is more mixed.
Recruitment firms
Benefit from a more confident labour market, more job moves and rising business investment in headcount.

These are not glamorous technology companies with global reach. They are often unglamorous, domestically focused businesses that have been out of favour for years. That is precisely what makes them interesting from a contrarian investment perspective. When a business is priced for permanent disappointment but the underlying conditions are quietly improving, the potential for a rerating can be substantial.

Concluding thoughts

The route from economic softness to consumer strength does not require a return to unusually strong nominal wage growth. Instead, it can come through falling inflation, rising real incomes and improving confidence. Consumers do not re-lever because rates are lower; they re-lever because they feel secure enough to borrow again. That is the bridge between the potential return of inflation towards target and the renewed domestic growth that could follow.

Likewise, the consumer does not move directly from caution to exuberance. There is an intermediate phase in which inflation falls, real incomes recover and balance sheets heal. Re-leveraging is typically the final step, not the first. The key insight for investors is that equity markets often recognise this transition well before it becomes visible in the economic data. We intend to be on the right side of this shift.

For patient investors willing to look through the current period of soft data and subdued sentiment, the UK domestic economy may be offering exactly the kind of opportunity that has previously rewarded contrarian thinking: the chance to invest in undervalued businesses before the recovery becomes obvious to everyone.


Key topics

Subscribe to insights

Get the most out of your email by tailoring the types of insights and information you would like to receive from us.

Latest articles

We look at how the UK domestic economic cycle operates and why the UK consumer recovery could be closer than you think.
His name is Lula, and a surprising election victory in Brazil saw spreads widen in local markets. Elsewhere, yield curves flattened in the US, Japan and Germany.
Renewed volatility across equity and bond markets reflects the convergence of several familiar risks: fiscal and political uncertainty in France, scrutiny of artificial intelligence-related investment, and renewed inflation concerns as oil prices rise.
Key topics
Related topics

1 Office for National Statistics, Average weekly earnings in Great Britain: October 2026
2 Office for National Statistics, Vacancies and jobs in the UK, October 2026
3 GfK Consumer Confidence Index, October 2026
4 Office for National Statistics, Average weekly earnings in Great Britain: October 2026
5 Office for National Statistics, Consumer price inflation, UK: August 2026
6 Bank of England, Interest rates and Bank Rate: our latest decision, 17 September 2026
7 HMRC, UK monhtlly property ransactions, September 2026

Important information

For use by professional clients and/or equivalent investor types in your jurisdiction (not to be used with or passed on to retail clients). For marketing purposes.

This document is intended for informational purposes only and should not be considered representative of any particular investment. This should not be considered an offer or solicitation to buy or sell any securities or other financial instruments, or to provide investment advice or services. Investing involves risk including the risk of loss of principal. Your capital is at risk.  Market risk may affect a single issuer, sector of the economy, industry or the market as a whole. The value of investments is not guaranteed, and therefore an investor may not get back the amount invested. International investing involves certain risks and volatility due to potential political, economic or currency fluctuations and different financial and accounting standards. The securities included herein are for illustrative purposes only, subject to change and should not be construed as a recommendation to buy or sell. Securities discussed may or may not prove profitable. The views expressed are as of the date given, may change as market or other conditions change and may differ from views expressed by other Columbia Threadneedle Investments (Columbia Threadneedle) associates or affiliates. Actual investments or investment decisions made by Columbia Threadneedle and its affiliates, whether for its own account or on behalf of clients, may not necessarily reflect the views expressed. This information is not intended to provide investment advice and does not take into consideration individual investor circumstances. Investment decisions should always be made based on an investor’s specific financial needs, objectives, goals, time horizon and risk tolerance. Asset classes described may not be suitable for all investors. Past performance does not guarantee future results, and no forecast should be considered a guarantee either. Information and opinions provided by third parties have been obtained from sources believed to be reliable, but accuracy and completeness cannot be guaranteed. This document and its contents have not been reviewed by any regulatory authority.

In Australia: Issued by Threadneedle Investments Singapore (Pte.) Limited [“TIS”], ARBN 600 027 414.  TIS is exempt from the requirement to hold an Australian financial services licence under the Corporations Act 2001 (Cth) and relies on Class Order 03/1102 in respect of the financial services it provides to wholesale clients in Australia. This document should only be distributed in Australia to “wholesale clients” as defined in Section 761G of the Corporations Act.  TIS is regulated in Singapore (Registration number: 201101559W) by the Monetary Authority of Singapore under the Securities and Futures Act (Chapter 289), which differ from Australian laws.

In Singapore: Issued by Threadneedle Investments Singapore (Pte.) Limited, 3 Killiney Road, #07-07, Winsland House 1, Singapore 239519, which is regulated in Singapore by the Monetary Authority of Singapore under the Securities and Futures Act (Chapter 289). Registration number: 201101559W. This advertisement has not been reviewed by the Monetary Authority of Singapore.

In Hong Kong: Issued by Threadneedle Portfolio Services Hong Kong Limited 天利投資管理香港有限公司. Unit 3004, Two Exchange Square, 8 Connaught Place, Hong Kong, which is licensed by the Securities and Futures Commission (“SFC”) to conduct Type 1 regulated activities (CE:AQA779). Registered in Hong Kong under the Companies Ordinance (Chapter 622), No. 1173058.

In Japan: Issued by Columbia Threadneedle Investments Japan Co., Ltd. Financial Instruments Business Operator, The Director-General of Kanto Local Finance Bureau (FIBO) No.3281, and a member of Investment Management Association of Japan and Type II Financial Instruments Firms Association.

In the UK: Issued by Threadneedle Asset Management Limited, No. 573204 and/or Columbia Threadneedle Management Limited, No. 517895, both registered in England and Wales and authorised and regulated in the UK by the Financial Conduct Authority.

In the EEA: Issued by Threadneedle Management Luxembourg S.A., registered with the Registre de Commerce et des Sociétés (Luxembourg), No. B 110242 and/or Columbia Threadneedle Netherlands B.V., regulated by the Dutch Authority for the Financial Markets (AFM), registered No. 08068841.

In Switzerland: Issued by Threadneedle Portfolio Services AG, Registered address: Claridenstrasse 41, 8002 Zurich, Switzerland.

In the Middle East: This document is distributed by Columbia Threadneedle Investments (ME) Limited, which is regulated by the Dubai Financial Services Authority (DFSA).  For Distributors: This document is intended to provide distributors with information about Group products and services and is not for further distribution. For Institutional Clients: The information in this document is not intended as financial advice and is only intended for persons with appropriate investment knowledge and who meet the regulatory criteria to be classified as a Professional Client or Market Counterparties and no other Person should act upon it.

This document may be made available to you by an affiliated company which is part of the Columbia Threadneedle Investments group of companies: Columbia Threadneedle Management Limited in the UK; Columbia Threadneedle Netherlands B.V., regulated by the Dutch Authority for the Financial Markets (AFM), registered No. 08068841.

Columbia Threadneedle Investments is the global brand name of the Columbia and Threadneedle group of companies. © 2026 Columbia Threadneedle. All rights reserved.

Related Insights

22 October 2026

Technology expertise at the source

In this video series, portfolio manager Vimal Patel together with senior analysts Nitin Saigal and Israel Hernandez share perspectives on opportunities emerging across the technology landscape.
7 October 2026

Senior Thematic Investment Analyst

US Fixed Income Utilities Analyst

AI data centres: Powering through the constraints

Artificial intelligence (AI) is driving one of the largest infrastructure investment cycles in decades. But converting billions of dollars of planned spending into operating data centres will depend on more than access to electricity.
5 October 2026

Artificial intelligence: implications for the economy and equity and fixed income markets

Artificial intelligence has moved from a narrow technology theme to a broad investment, productivity and financing cycle that will impact almost every aspect of financial markets.
27 October 2026

In Credit Weekly Snapshot – Copacabana

His name is Lula, and a surprising election victory in Brazil saw spreads widen in local markets. Elsewhere, yield curves flattened in the US, Japan and Germany.
26 October 2026

Senior Economist, Multi-Asset Solutions team

Market Perspectives: The sum of all fears

Renewed volatility across equity and bond markets reflects the convergence of several familiar risks: fiscal and political uncertainty in France, scrutiny of artificial intelligence-related investment, and renewed inflation concerns as oil prices rise.
26 October 2026

Head of Research, European Real Estate

UK Real Estate: Talking Points October 2026

Welcome to our concise quarterly snapshot of current real estate market trends.

Important information

For use by professional clients and/or equivalent investor types in your jurisdiction (not to be used with or passed on to retail clients). For marketing purposes.

This document is intended for informational purposes only and should not be considered representative of any particular investment. This should not be considered an offer or solicitation to buy or sell any securities or other financial instruments, or to provide investment advice or services. Investing involves risk including the risk of loss of principal. Your capital is at risk.  Market risk may affect a single issuer, sector of the economy, industry or the market as a whole. The value of investments is not guaranteed, and therefore an investor may not get back the amount invested. International investing involves certain risks and volatility due to potential political, economic or currency fluctuations and different financial and accounting standards. The securities included herein are for illustrative purposes only, subject to change and should not be construed as a recommendation to buy or sell. Securities discussed may or may not prove profitable. The views expressed are as of the date given, may change as market or other conditions change and may differ from views expressed by other Columbia Threadneedle Investments (Columbia Threadneedle) associates or affiliates. Actual investments or investment decisions made by Columbia Threadneedle and its affiliates, whether for its own account or on behalf of clients, may not necessarily reflect the views expressed. This information is not intended to provide investment advice and does not take into consideration individual investor circumstances. Investment decisions should always be made based on an investor’s specific financial needs, objectives, goals, time horizon and risk tolerance. Asset classes described may not be suitable for all investors. Past performance does not guarantee future results, and no forecast should be considered a guarantee either. Information and opinions provided by third parties have been obtained from sources believed to be reliable, but accuracy and completeness cannot be guaranteed. This document and its contents have not been reviewed by any regulatory authority.

In Australia: Issued by Threadneedle Investments Singapore (Pte.) Limited [“TIS”], ARBN 600 027 414.  TIS is exempt from the requirement to hold an Australian financial services licence under the Corporations Act 2001 (Cth) and relies on Class Order 03/1102 in respect of the financial services it provides to wholesale clients in Australia. This document should only be distributed in Australia to “wholesale clients” as defined in Section 761G of the Corporations Act.  TIS is regulated in Singapore (Registration number: 201101559W) by the Monetary Authority of Singapore under the Securities and Futures Act (Chapter 289), which differ from Australian laws.

In Singapore: Issued by Threadneedle Investments Singapore (Pte.) Limited, 3 Killiney Road, #07-07, Winsland House 1, Singapore 239519, which is regulated in Singapore by the Monetary Authority of Singapore under the Securities and Futures Act (Chapter 289). Registration number: 201101559W. This advertisement has not been reviewed by the Monetary Authority of Singapore.

In Hong Kong: Issued by Threadneedle Portfolio Services Hong Kong Limited 天利投資管理香港有限公司. Unit 3004, Two Exchange Square, 8 Connaught Place, Hong Kong, which is licensed by the Securities and Futures Commission (“SFC”) to conduct Type 1 regulated activities (CE:AQA779). Registered in Hong Kong under the Companies Ordinance (Chapter 622), No. 1173058.

In Japan: Issued by Columbia Threadneedle Investments Japan Co., Ltd. Financial Instruments Business Operator, The Director-General of Kanto Local Finance Bureau (FIBO) No.3281, and a member of Investment Management Association of Japan and Type II Financial Instruments Firms Association.

In the UK: Issued by Threadneedle Asset Management Limited, No. 573204 and/or Columbia Threadneedle Management Limited, No. 517895, both registered in England and Wales and authorised and regulated in the UK by the Financial Conduct Authority.

In the EEA: Issued by Threadneedle Management Luxembourg S.A., registered with the Registre de Commerce et des Sociétés (Luxembourg), No. B 110242 and/or Columbia Threadneedle Netherlands B.V., regulated by the Dutch Authority for the Financial Markets (AFM), registered No. 08068841.

In Switzerland: Issued by Threadneedle Portfolio Services AG, Registered address: Claridenstrasse 41, 8002 Zurich, Switzerland.

In the Middle East: This document is distributed by Columbia Threadneedle Investments (ME) Limited, which is regulated by the Dubai Financial Services Authority (DFSA).  For Distributors: This document is intended to provide distributors with information about Group products and services and is not for further distribution. For Institutional Clients: The information in this document is not intended as financial advice and is only intended for persons with appropriate investment knowledge and who meet the regulatory criteria to be classified as a Professional Client or Market Counterparties and no other Person should act upon it.

This document may be made available to you by an affiliated company which is part of the Columbia Threadneedle Investments group of companies: Columbia Threadneedle Management Limited in the UK; Columbia Threadneedle Netherlands B.V., regulated by the Dutch Authority for the Financial Markets (AFM), registered No. 08068841.

Columbia Threadneedle Investments is the global brand name of the Columbia and Threadneedle group of companies. © 2026 Columbia Threadneedle. All rights reserved.

Icon checked

Thank you. You can now visit your preference centre​ to choose which insights you would like to receive by email.

Icon checked

Thank you. You can now visit your preference centre​ to choose which insights you would like to receive by email.