Bellevue Healthcare Trust plc (to be renamed):
CT Healthcare Trust PLC (CTHT)
For non-professional investors. Please seek financial advice before making any investment decisions.
Please refer to the Glossary at the end for financial definitions.
Introduction
CT Healthcare Trust’s investment strategy is based on Columbia Threadneedle’s Seligman Healthcare Strategy. It seeks to capture opportunities arising from healthcare innovation and broad sector trends, while also identifying companies that may face structural or clinical challenges.
The strategy has an emphasis on biotechnology and pharmaceutical companies but will invest across the range of healthcare companies covering all sub-sectors and geographical regions.
1 As at 5th March 2026.
Investment process
Most investors highlight healthcare’s groundbreaking innovations shaping diagnostics, AI use, and treatments, alongside aging demographic trends incorporating the standard and financing of care2. While these advances are real and extraordinary, our thesis is different: healthcare is one of the best sectors for delivering returns above sector indices (also known as alpha).
The sector exhibits one of the widest dispersions between winners and losers of any industry, amplified by volatility in clinical data and regulatory decisions, which can affect company share prices quickly.
Unlike other areas of the market, success in healthcare investing often requires specialist knowledge and an understanding of complex scientific and clinical information. These complexities make healthcare less accessible to non-specialists and less replicable by AI or purely quantitative models. That inefficiency is opportunity, and the team’s goal is specifically to exploit this environment.
2 Source: Morgan Stanley “5 Healthcare Trends from the Industry’s Top Companies” September 2025.
Explaining CT Healthcare Trust’s dual-directional portfolio approach
We manage the portfolio by combining “long” positions, benefitting from investment in companies we expect to rise in value, with “short” positions in companies we believe face structural or clinical challenges.
The team brings specialist technical experience to interpreting complex scientific and medical data, which helps inform their views ahead of study results that can lead to significant movements in company share prices, both positive and negative.
With over 90% of drugs and biotech programs ultimately failing3, the opportunity to benefit from well-researched portfolio positioning is robust. At the same time, established healthcare companies such as med-tech leaders, hospitals, and other secular compounders, provide durable growth and recession-resistant revenue, balancing the higher-risk but high reward profiles of earlier-stage biotech companies.
This blend of innovation‑driven opportunities, disciplined use of short positions, and diversification across healthcare subsectors helps make this dual-directional approach a flexible way to manage risk and return.
3 Source: National Library of Medicine: https://pmc.ncbi.nlm.nih.gov/articles/PMC9293739/ February 2022.
Goals & Objectives
- The strategy offers shareholders an equity portfolio with modest net exposure, so overall performance depends more on stock selection than whether the market rises or falls.
- Its investment objective is to provide an absolute return by investing in an actively managed portfolio of equities and derivatives (financial contracts whose value is dependent on the value of other instrument(s) such as a stock or bond), with exposure to the global healthcare market.
- In doing so, it aims to participate in a majority of the healthcare potential upside while seeking to help manage downside risk.
- The strategy has, at times, delivered positive returns in periods when healthcare indices have risen as well as when they have fallen. Its balanced approach, disciplined risk management, and focus on upside and downside targets aim to support performance across different market environments, although this is not guaranteed.
- The strategy will be exposed to healthcare and healthcare-related equities, with most exposure being in US-listed companies. Current US weighting in the strategy is in the region of 85-90%, but that may change over time. The balance of the portfolio offers exposure to Europe and Asia. The latest factsheet will offer the current breakdown.
- The team deploys a disciplined portfolio construction: typical characteristics are a gross exposure of 120–165%, and net exposure between 0% and 50%. The top 10 long positions typically make up 25–30% of the portfolio, while the top 10 short positions range from 12–18%, balancing conviction with diversification.
- Positions are actively managed against strict upside/downside targets, with higher-risk names sized smaller and durable compounders larger.
- There will be no comparable benchmark for the portfolio, although we offer related healthcare index performances to aid analysis.
Lead manager & team
The lead manager of our healthcare strategy is Kosta Kleyman who is based in New York, USA. Kosta has a professional Doctorate in Pharmacy (PharmD). He led cancer drug commercialisation and clinical development for seven years at top-tier pharmaceutical and biotech companies such as Genentech/Roche and AstraZeneca. He began his investment management career at a single manager healthcare-dedicated hedge fund prior to joining Columbia Threadneedle Investments in 2020.
Kosta has developed deep rapport with management teams, thanks to the strong relationships established while working in the healthcare industry, which has helped inform his investment understanding. He is supported by a healthcare team of eight analysts, combining deep scientific training with specialised healthcare expertise. The group includes professionals with PhDs, PharmDs, MScs, and so forth, providing the technical foundation to evaluate complex clinical data, regulatory filings and medical literature.
The team is organised with sub-sector specialists across biotech, pharma, med-tech, healthcare services, and treasuries, ensuring comprehensive coverage of the full healthcare landscape. This combination of technical rigour, sector specialisation and scale enhance their ability to identify inflection points, anticipate regulatory outcomes, and underwrite investments with conviction.

Why Columbia Threadneedle Investments for Healthcare?
Portfolio construction
Approximately two thirds of the strategy is focused on biotech or pharma, as this is where many of the opportunities lie, with the balance allocated across other sub-sectors such as med-tech services and tools.
The largest long positions are typically 3-4%, and short positions around 2-3% with higher volatile investments typically sized below 1%.
Risk is managed by maintaining a broad portfolio of multiple positions of smaller size, so no single position can overwhelm performance.
Performance
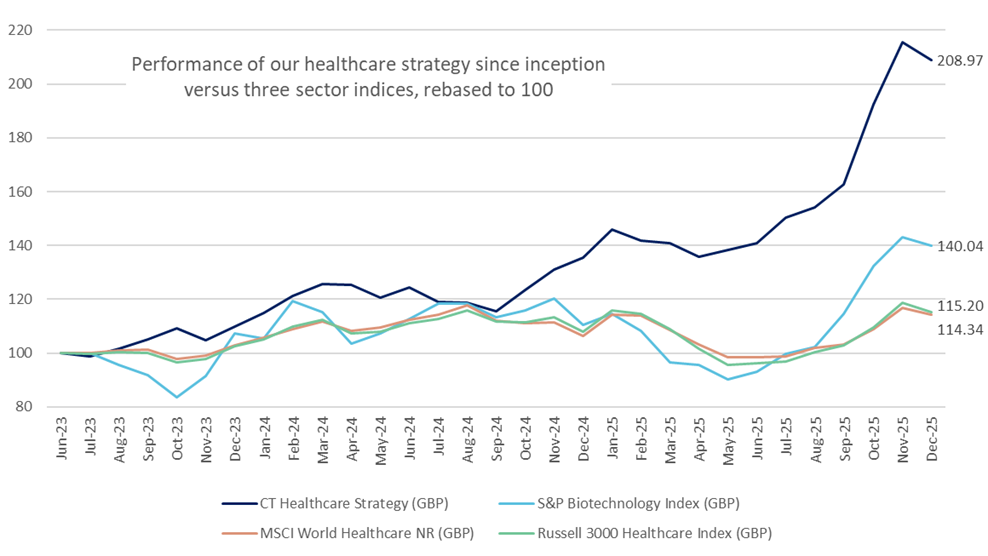
Performance has shown our investment process has the ability to generate absolute returns, in a risk adjusted manner, that has delivered consistent alpha across different market conditions.
The chart below shows cumulative returns for the Seligman Healthcare strategy, the strategy the CT Healthcare Trust will follow, net of estimated fees4, against key relevant market indices, in GBP, since inception.
The Seligman Healthcare strategy GBP cumulative returns (net of estimated fees4) vs selected indices
Our Healthcare Strategy | S&P Biotech Index | MSCI World Healthcare NR Index | Russell 3000 Healthcare Index | |
|---|---|---|---|---|
1-Month Return | -3.1% | -2.1% | -2.2% | -3.0% |
3-Month Returns | 28.4% | 22.2% | 10.8% | 12.0% |
6-Month Returns | 48.4% | 50.4% | 16.3% | 19.8% |
YTD Returns | 54.1% | 26.6% | 7.5% | 6.7% |
1-Year Returns | 54.1% | 26.6% | 7.5% | 6.7% |
2-Year Returns | 90.2% | 30.4% | 11.2% | 12.4% |
Cumulative Returns | 109.0% | 40.0% | 14.3% | 15.2% |
July 2023-June 2024 | 24.4% | 12.6% | 12.3% | 11.1% |
July 2024-June 2025 | 13.2% | -17.3% | -12.5% | -13.4% |
July 2025-Dec 2025 | 48.4% | 50.4% | 16.3% | 19.8% |
Annualised Returns | 34.3% | 14.4% | 5.5% | 5.8% |
Source: Columbia Threadneedle Investments & Factset. Inception date is 1st July 2023. Data as of 31st December 2025. All data is cumulative total return assuming reinvestment of income and capital gains, net of estimated fees4, in GBP. Periods over one year are annualised since inception. Past performance is not a guarantee of future results.
4 The Seligman Healthcare data is Net Asset Value performance net of management fee (0.95%), operational expenses (estimated to be 0.46%; the exact cost is dependent on the CT Healthcare Trust’s net assets) and any incentive/performance fee earned (absolute return above costs (0.95% + 0.46%) plus cash, as defined as 3-month SONIA, subject to a high watermark).
Key documents
- Annual Report and Accounts
- Investor Disclosure Document
- Circular
- KID available soon
- Factsheet (data as at 31 March) available from April 2026
In summary

1. Our investment process is a diversified approach to global healthcare investing. Its aim is to capture returns from stock selection on both sides of the market, rather than relying solely on broad market direction, with a focus within therapeutics.
2. We blend deep operating expertise and catalyst-driven processes with disciplined exits, utilising a low net exposure strategy that not just acts as a hedge (reducing market risk); it actively generates alpha by seeking to outperform the market.
3. This, combined with preferred deal access and disciplined portfolio construction, result in more consistent, uncorrelated returns with lower volatility and attractive risk measurements compared to general healthcare sector indices.
Our investment trust business
We can trace our investment roots back to 1868, when F&C Investment Trust, the world’s oldest collective investment scheme launched, and have been adding to our offering ever since. We currently manage eight Investment Trusts with over £9.5bn in total assets5, providing a range of investment opportunities including access to equities, bonds, property and private equity. Each trust has different aims and objectives with the option of capital growth, income or a combination of both and with a specific regional focus or with a global remit.
Please visit our dedicated Investment webpage for further information on our range of Investment Trusts. Professional investors can email us on [email protected] or contact your regular Columbia Threadneedle representative for more information.
5 Source: Columbia Threadneedle Investments as at 5th March 2026.
There are a variety of ways to contact us
Call us on
Calls may be recorded or monitored for training and quality purposes.
The cost of your call will depend on what phone line you are using.
For full details visit:
https://www.gov.uk/call-charges
New and existing customers:
0345 600 3030 (from UK)
+44 1268 447 407 (from overseas)
Lines open weekdays 9am-5pm
Email us on
New customers:
Existing customers:
For professional investors:
[email protected] or contact your Columbia Threadneedle representative.
*We aim to respond within 3 business days
Write to us at
Glossary
Absolute Return
Unlike traditional funds that aim to beat a market index (like the FTSE 100), an absolute return strategy aims to deliver positive returns in all market conditions – whether markets are rising or falling.
Alpha
The term alpha, with regards to investing, is a measure of an investment’s performance relative to a benchmark index (e.g., the FTSE 100 index), representing the excess return or “active return” on an investment. It signifies a portfolio manager’s ability to “beat the market” through skilful stock picking or strategy.
Annualised Returns
Annualised returns show the average yearly return of an investment over a specific period of time, assuming the investment grows at a steady rate each year.
For example, if you invest £1,000 and it grows to £1,300 over three years, the cumulative return is 30%. The annualised return would show the average yearly growth rate that led to that result – about 9.14% per year.
Cumulative Returns
Cumulative returns show the total percentage gain or loss of an investment over a specific period of time. They measure how much your investment has grown (or declined) from the starting point to the end of the period, including all profits, losses, dividends, and interest earned.
For example, if you invested £1,000 and it grew to £1,300 over three years, the cumulative return would be 30%. This means your investment increased by 30% in total over that time.
Cumulative returns help you understand the overall performance of an investment, but they do not show how the investment performed on average each year, nor in any individual year. For that, you would look at annualised returns or calendar year returns respectively.
Derivatives
Derivatives are financial contracts that derive their value from an underlying asset, rate, or index, such as stocks, bonds, commodities, or currencies. They are primarily used to hedge risk (manage uncertainty) or speculate on price movements. These, including futures, forwards, options, and swaps, allow investors to gain exposure to markets without owning the actual asset.
Gross & Net Exposure
Gross Exposure refers to the total amount of money invested in both long and short positions within a portfolio. It represents the combined value of all investments, regardless of whether they are expected to rise (long) or fall (short) in value.
For example, if a portfolio invests £100 million in long positions and £50 million in short positions, the gross exposure is £100m + £50m = £150 million. The net exposure is the difference between long and short positions, which is £100m – £50m = £50 million.
Gross exposure can also be shown as a percentage of long positions: dividing gross exposure (£150 million) by long positions (£100 million) equals 1.5, which, when expressed as a percentage = 150%.
Net exposure as a percentage equals long positions (£100 million) minus the short positions (£50 million), divided by long positions, i.e., (£100m-£50m)/£100m = 50/100 = 0.5, or 50% expressed as a percentage.
Gross exposure helps show how actively the portfolio is invested, and a higher gross exposure may indicate a more aggressive investment approach. However, it does not reflect the overall risk to your capital, which is better represented by net exposure and other risk measures.
Risk is managed by maintaining a broad portfolio of multiple positions of smaller size, so no single position can overwhelm performance.
High Watermark
A high watermark in investments is the highest value — specifically the highest Net Asset Value (NAV) per share — that an investment fund or portfolio has reached. It serves as a performance threshold that a fund manager must surpass before they are entitled to charge performance-based fees.
Long Positions
A “Long” position is defined as taking a position in shares or derivatives (“investing”) in companies expected to grow, especially those driving innovation. The strategy benefits when the share price of long positions go up.
Short Positions
A “Short” position is defined as taking a position in shares or derivatives in companies expected to face challenges, which may add to performance as well as help manage risk and protect your investment. The strategy benefits when the share price of short positions go down.
Important information
Your capital is at risk.
This financial promotion is issued for marketing and information purposes only by Columbia Threadneedle Investments in the UK.
The Investor Disclosure Document, Key Information Document (KID), latest annual or interim reports and the applicable terms & conditions are available from Columbia Threadneedle Investments at Cannon Place, 78 Cannon Street, London EC4N 6AG, your financial advisor and/or on our website www.columbiathreadneedle.com. Please read the Investor Disclosure Document before taking any investment decision.
This material should not be considered as an offer, solicitation, advice or an investment recommendation. This communication is valid at the date of publication and may be subject to change without notice. Information from external sources is considered reliable but there is no guarantee as to its accuracy or completeness.
In the UK: Issued by Columbia Threadneedle Management Limited, No. 517895, registered in England and Wales and authorised and regulated in the UK by the Financial Conduct Authority.
Columbia Threadneedle Investments (Columbia Threadneedle) is the global brand name of the Columbia and Threadneedle group of companies.
© 2026 Columbia Threadneedle. All rights reserved.